The 2017/18 financial year showed a few positive results and some concerning trends, Resource Consulting Services has revealed in its latest Profit Probe annual economic benchmarking report.
Sheep prices stayed relatively static during the financial year whilst broadacre farmers enjoyed solid prices for those able to harvest, RCS chairman David McLean said.
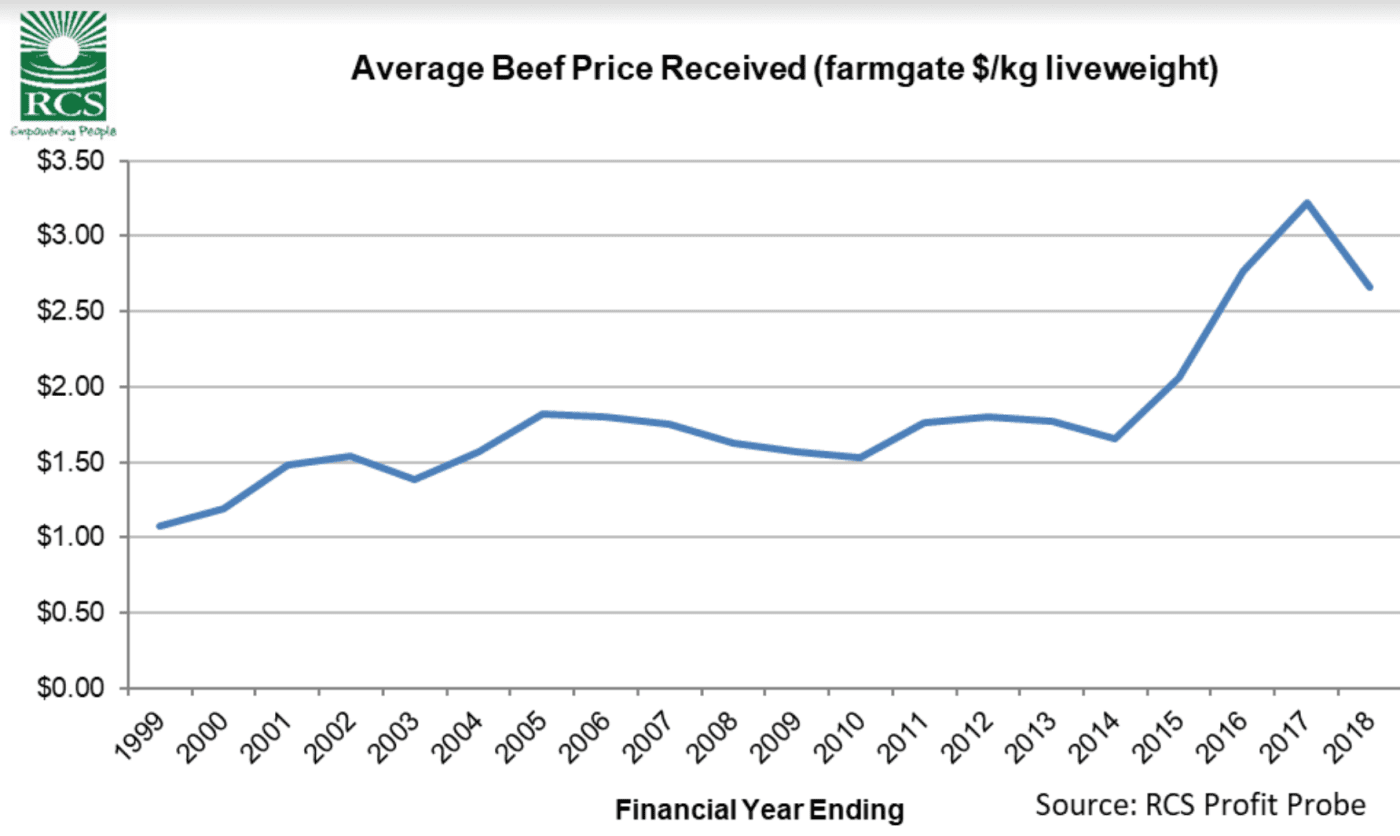
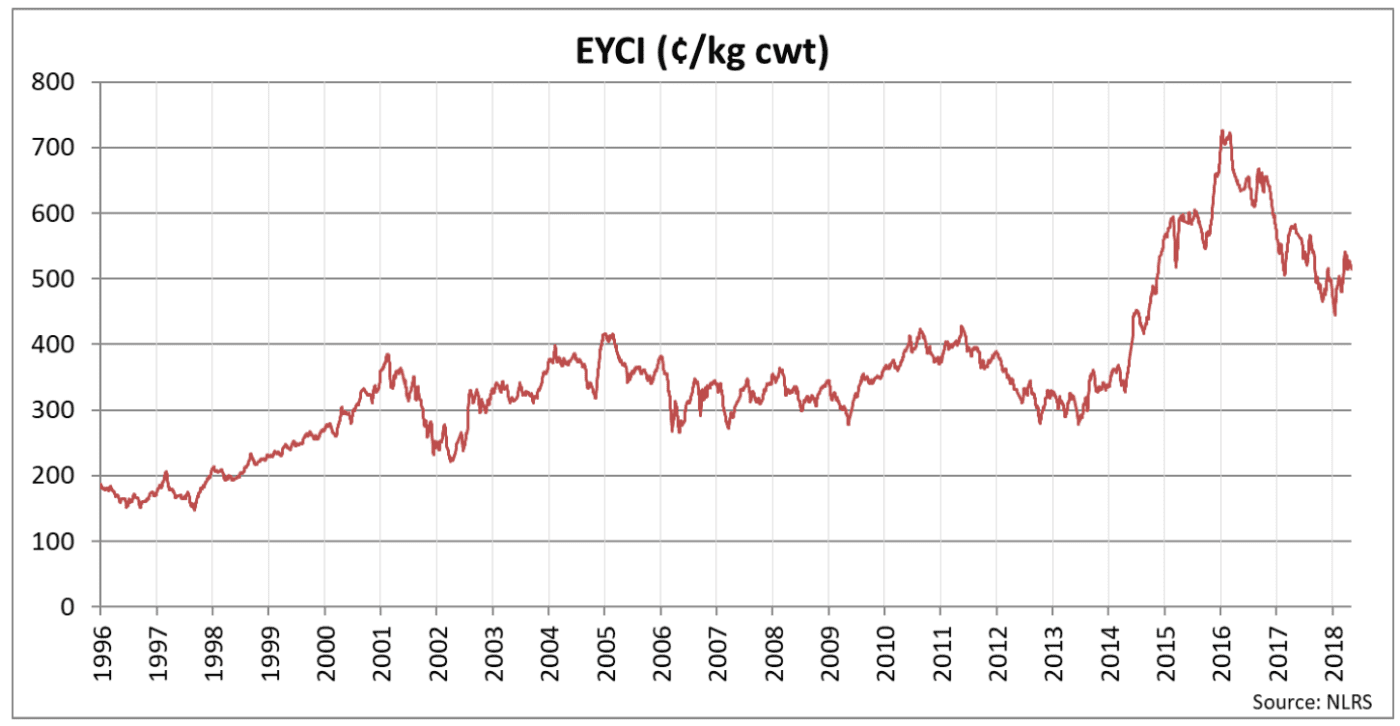
The cattle market however experienced a 25pc slump with the average price received dropping to $2.66/kg liveweight, down from it’s record peak of $3.22/kg in the 2016/17 financial year (see graph below).
In economic benchmarking, the cash and non-cash components of running a business are included in the analysis.
- Depreciation of vehicles etc is the most well-known non-cash cost that is used.
- It includes unpaid labour (non-cash: the real cost of labour used to run the business if you paid everyone a market wage for work that needed to be done) and excludes drawings (the cash you draw out for that work that was done).
- The final and biggest component is change in inventory. This accounts for the movements in the number and value of your livestock or crops in silos through the year (using your stockflow and cropflow documents). For livestock, the breeding females open and close the year at the same value. The trading/growing animals however are valued at market value (RCS uses MLA market indicators such as EYCI/ETLI as a base valuation to indicate trend). The 25pc reduction in cattle market means that a 200kg weaner out in the paddock was worth approximately $167 less this year than last year. A 400kg steer was worth $333 less. Whilst the cattle market was going up, it helped improve gross product as the closing inventory was worth more each year from 2013/14 to 2016/17 (see graph above).
“This, when combined with the drought conditions and increasing input costs, has equated to some numbers we’ve never seen in ProfitProbe,” Mr McLean said.
The Top 20pc numbers in the 2018 report are the results achieved by the top 20pc businesses as ranked by the highest return on asset (ROA – i.e. what are the characteristics of the most profitable businesses).
The Top 20pc achieved a 4.2pc ROA for the financial year.
The Molotov cocktail of factors has seen the average return on assets equal 0.0pc (yes, zero).
It has never been this low since RCS started benchmarking via Profit Probe in 1994. The previous low was 0.2pc in 2012/13.
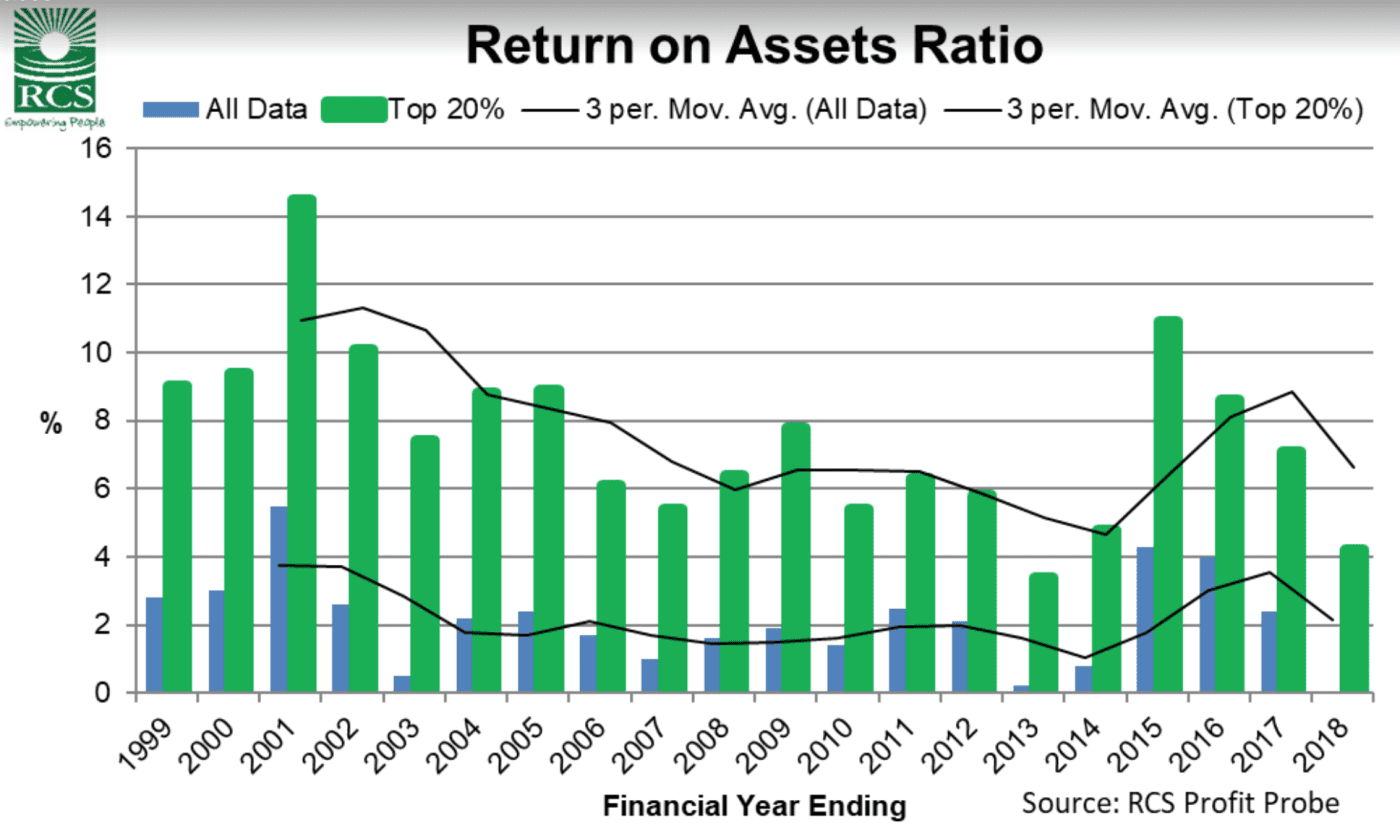
It is worth noting that ROA has declined for four years in a row now, despite the cattle market reaching its peak during the 2016/17 FY.
Mr McLean said this emphasised the low relationship between profit and price received.
He said some people would read this and not agree for two reasons:
“First, they don’t like the negative result. If the average result is zero, then that means a lot of businesses returned a negative result. I’ve had a lot people disagree with how we value the inventory this year. I didn’t get any where near as much feedback when the cattle market went up and it boosted results though. We’ve used the same valuation philosophy since the 90s.
“Secondly, they may feel as though things went pretty well as there could have been some free cash flow. This may well have been the case however it’s important to separate cash flow from management accounting, both of which are important to know.
“If you want to analyse your business without the un-controllable influences of market prices, then cost of production (COP) the best number in my opinion. Despite the ROA results, COP data shows us that the average producer has tightened up the belt in the last few years and improved the relationship between production and costs. The Top2 0pc COP was $1.18/kg compared to the average of $1.58/kg. These results only include direct costs and overhead costs to run the business and exclude interest which was, on average, an additional $0.35/kg produced.
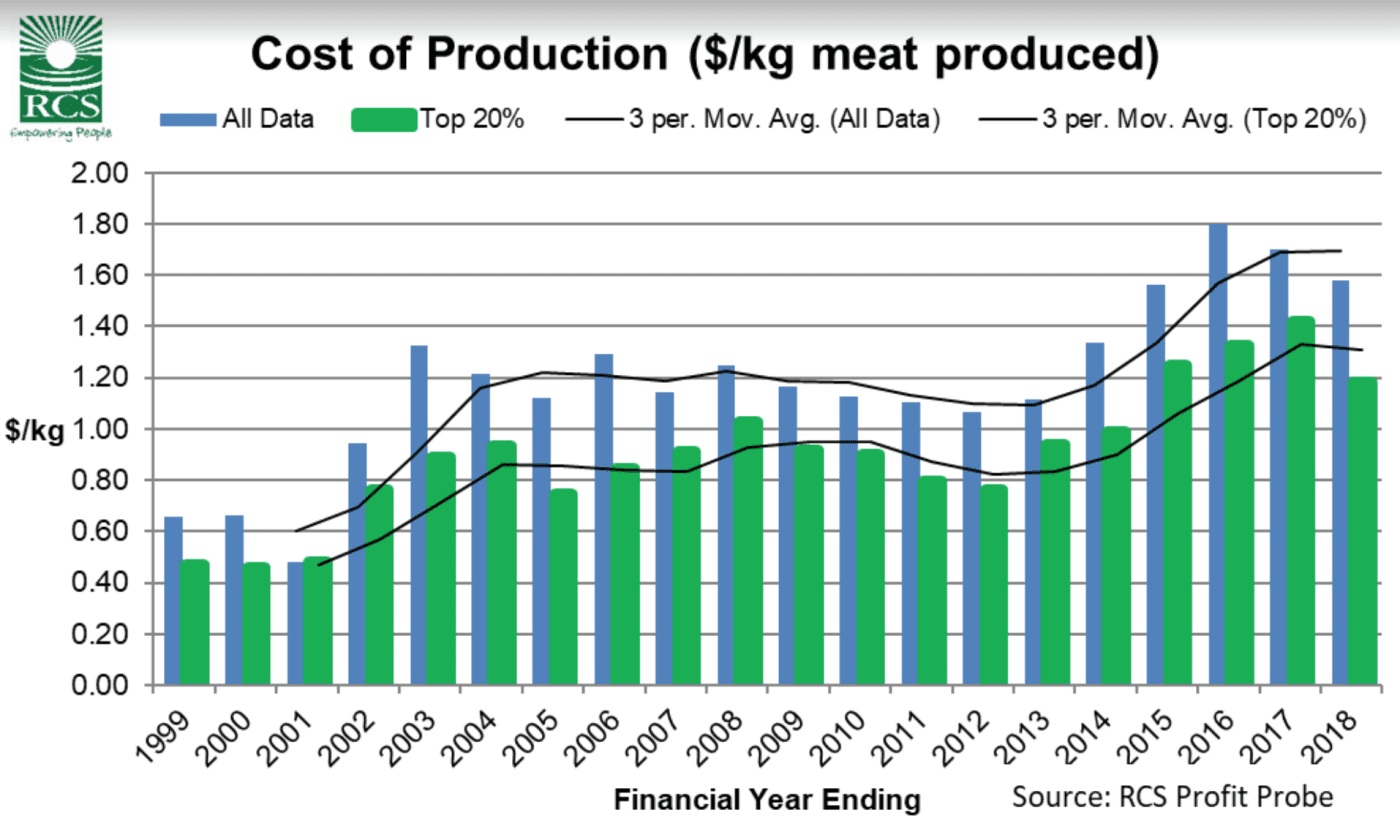
“COP is an indicator of our ability to withstand market variation. Financial success doesn’t come from how much we produce, what we get paid or how miserly we are. It comes from the DIFFERENCE between what the market pays us and the COP (costs divided by production). If you went through your business and considered every cost line item as an investment, what return on investment are you getting from each one? Could it be better?
“Whilst COP has declined, I am concerned about the $1.58/kg average, as it simply doesn’t provide a big enough margin to achieve most businesses goals (e.g. growth, expansion, re-investment, other investments, debt reduction, succession, management transition etc).”
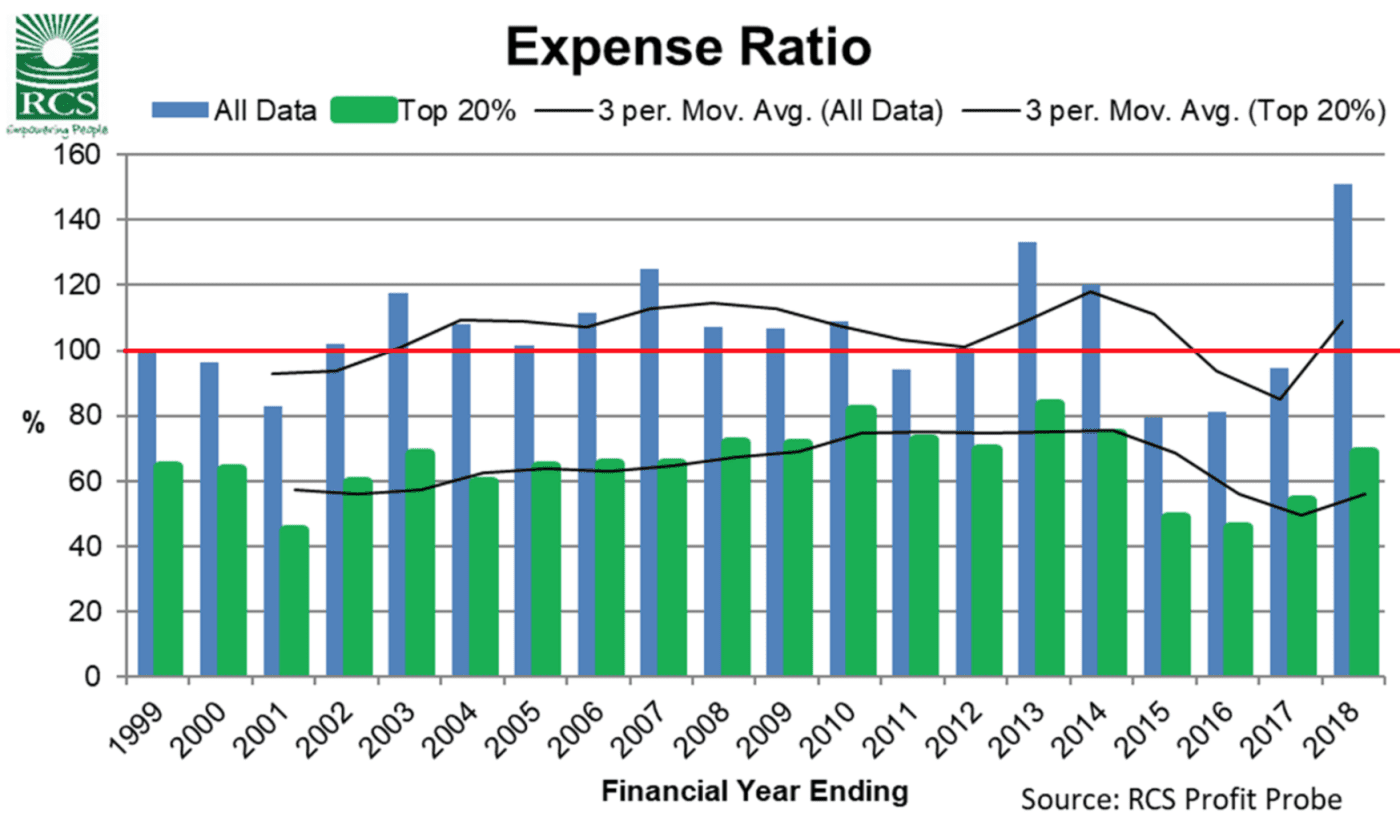
A number that previous readers will have seen is the expense ratio. This is the relationship between the economic value of production (gross product) and the total costs (direct costs + overhead costs + interest costs). If it is over 100% then we’ve spent more than we’ve earned. In economic terms, the average producer was over 100% for most of the 2000’s. The increase in inventory diluted the results for a few years from 2014/15 to 2016/17. However, the increase in COP during this period means that once the inventory value stopped going up (remember it went down a lot for trade cattle), the expense ratio has jumped up to 151pc on average and 69pc for the Top20pc.
Mr McLean said the final benchmarking data included this year “unfortunately very sobering”.
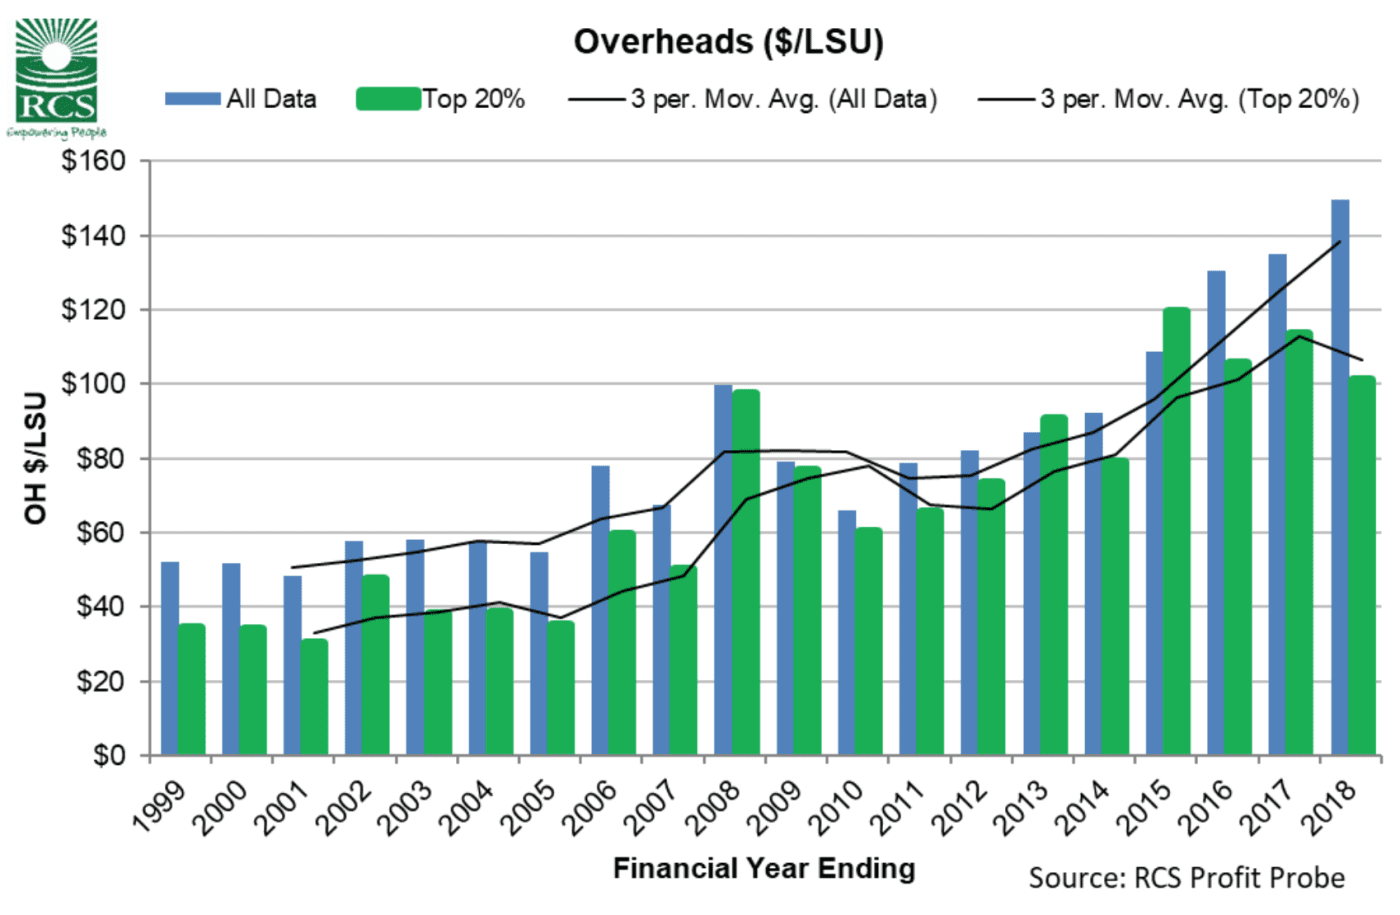
It is the total overhead costs on a per LSU (large stock unit) basis.
The Top 20pc businesses have kept this relationship in check (which is one of the reasons why they are in the Top20 pc). However, for the average beef producer, overheads per LSU has increased for eight years in a row, averaging an annual increase of 11pc.
“Where to from here? There are some sobering numbers here. I interpret them as presenting some great opportunities for those operators who know what is going on in their business and are ready to take advantage of these opportunities when they present themselves.
“This is what I’d do:
“Firstly, know what the numbers are for your business. There is not silver bullet and you need to know your current reality. It isn’t too late to analyse your business via Profit Probe.
“If you’ve already done that, then make sure you know what the key numbers you need to focus on are (use the help videos and documents available plus your advisor). What are your strengths and weaknesses (we all have them)? Build on those strengths and address your weaknesses. Don’t look at these numbers above and think they apply directly to your business. Know where your deadwood is and cut it out!
“Ask yourself what return on investment you get from each of your costs. Have any un-necessary costs crept in? If you had to, or wanted to, what costs could be cut out?
“What does this year look like? If you had an enterprise that made a loss last year, is it going to do it again? If it is, then what are you going to do about it?
“Finally, check that your current business model is appropriate for the current reality of market conditions. If we look at the variation in EYCI over the past 20 years, we spent nearly 15 years in a 100c/kg bracket of 300-400. The variation is now much greater.
“What will it do in the future? Nobody can predict this with confidence. My suggestion is that you consider your business operating model with respect to each enterprises ability to be profitable with the assumption of large variability.”
To discuss benchmarking and analysing your business, contact the RCS team on 1800 356 004, email info@rcsaustralia.com.au, or visit this page of their website.
Thank you RCS for the update on our industry’s financial progress. It draws out some interesting and concerning issues.
One of the problems cattle producers face in the north and south is the ever increasing size of cows. This has developed over the past 30 years due to our mistaken concentration on the livestock weight of the cattle turned off. Too often we try to make the land fit the animal rather than the animal fit the land.
We should measure our financial performance as profit per hectare and not profit per head or per kg. Supplementary feeding has become the norm when it should be the exception. We are producing curve benders when we should be producing animals that can survive our drier conditions.
As producers battle to stay up with the latest advice and build bigger and better tools on their farms, they increase overheads and riase the bar that much higher. There has also been significant intrusion by bureaucrats into our businesses. Integrity Systems, a subsidiary of MLA, send out their inspectors to review our Biosecurity Plans and send us to the boundary if we do not comply. They claim LPA is voluntary, but refuse to supply non-LPA vendor declarations to send our stock to market. We are forced into re-accreditation into LPA and pay their self-imposed $66 fee. They operate a national JBAS system to protect WA farmers from importing BJD even though WA has not tested their herd for Johne’s disease for 15 years. All of this intrusion into our business does nothing improve our bottom line and increases the cost of running our business.
We suggest you consider providing your analysis for northern cattle producers and a separate analysis for southern producers. The dynamics of stations versus farms are very different and we need to understand what factors are impacting our financial performance in both regions. It would also be helpful if we could see the mean and standard variation for your figures. This would assist in comparing the top 20% with the population.
In our export markets Australia is a price taker. The world price for beef in FMD-free countries is set by the USA domestic market. This is why the reports provided by Beef Central from Steve Kay and Simon Quilty are so important in understanding trends and forecasts in price. Occasionally some cuts are impacted by countries other than the USA, but world pricing of beef is determined by the supply and demand for beef in the USA market. Processors in the US have the upper hand in sharing the beef income with producers and feedlotters currently, and this is likely to persist over the next 12 months. Here it is likely to be the other way round with processors chasing supply to keep their sheds in production. More of the income will be received by our producers and feedlotters over the next 12 months.
It is time our industry gave consideration to improving the profitability of cattle production by reducing the grass-fed transaction levy. Currently it is $5 per head. Cattle Council needs to consult closely with MLA and see what activities should be reduced or eliminated so the levy can be reduced to $3.50. Producers should be asked to pay $0.50 of this reduction to Cattle Council by way of an annual fee to finance their representation and advocacy roles for our industry. This will allow CCA to stop compromising their corporate governance by ceasing their annual income paid by MLA from our levies to manage projects.
The remaining $1 must be returned to producers to pay for the costs of meeting bureaucracy’s more recent intrusion into beef production.
Australian Cattle Industry Council
Excellent !! Well done to David, and RCS … concise, factual, and right on the money … though I do wonder what the Return in Equity might be … and also the levels of leverage to produce those results … 😊
Many have borrowed a lot, and then met the perfect storm of continuing severe drought, AND falling Gross Revenue … combined with rising costs in a deflationary environment … interesting times ahead.