THE LEVEL of cattle throughput is the dominant factor in profit margins – or in deed, losses – achieved by Australian beef processors, a new economic study undertaken by the Australian Meat Processor Corporation has illustrated.
The study shows a long-term average processor margin of $25 per head of cattle slaughtered over the past 11 years, but most significantly, three distinct periods of positive and negative margins (more details below).
AMPC has developed a representative processor profit margin model to gain insight into the drivers of economic performance and sustainability in the red meat processing industry.
The model suggests the processing industry has sustained three consecutive years of negative margins since 2016-18, with last year’s annual processor margin estimated at negative-$14.
Based on MLA’s cattle industry projections for reduced slaughter cattle supply in coming years due to the heavy impact of drought, is unlikely to see a return to positive margins until 2022. If that scenario proves correct, it would represent six consecutive years of negative beef processor margins, and potentially, extreme financial stress on some, if not most processing companies.
Past sequences of negative margin years (see graph below) have correlated closely with long-term and permanent plant closures.
Low-margin, high-throughput business
The findings from the model are consistent with the widely-accepted view that red meat processing in Australia is a low-margin business, relying on high throughput and high capacity utilisation to generate returns.
AMPC’s economic model incorporates data from the recently-released Cost to Operate report (see today’s separate story) and other publicly-available industry data.

AMPC economist, George Revell
Produced by AMPC’s agricultural economist, George Revell, the model is built around a representative single-species beef plant, processing a mix of grass and grainfed steers representative of the national supply, purchased through a combination of direct consignment and saleyard channels and sold as 15 meat products and 24 co-products. The model assumes the plant is operating at a capacity utilisation representative of national throughput (current average annual utilisation of 75pc, ranging from 67–90pc).
The formula shows that over the past 11 years, cattle throughput has been the primary driver of processor margin, with 76 percent of the variation explained by the level of cattle throughput alone.
Mr Revell said the representative cattle processor model had been developed to be a tool for AMPC and industry stakeholders to objectively assess the drivers of processor economic performance.
“Given the many assumptions required to build the model, this should not be seen as a whole-of-industry model, but simply a reflection of an average industry participant. Due to the diversity of plant size, operational processes and supply chain focus across the processing industry, individual processors will certainly vary from the modelled results, however the model provides an indicator of the broad industry trend,” he said.
AMPC plans to update the margin figures on a regular basis – perhaps quarterly – and make the information available to the broader industry.
“This information also has broader economic and social impacts, particularly on regional communities where the majority of Australian processors are located,” Mr Revell said.
Contrast with other models
Ruralco’s economic analysis and forecasting company, Mecardo, already produces a theoretical beef processor margin figure, using its own modelling and assumptions, but AMPC points out that the two models differ in several important ways – particularly in the area of breaking down processing costs.
Unlike Mecardo’s model which relies on publicly-accessible saleyards cow prices as its sole source of slaughter stock pricing, AMPC’s formula focuses on a combination of both grassfed and grainfed steers bought direct and via saleyards, which it suggests is more representative.
“While the differences understandably result in some short-term variations, much of the data and the methodology used in both models is similar, and the overall model trend is comparable,” AMPC’s report says.
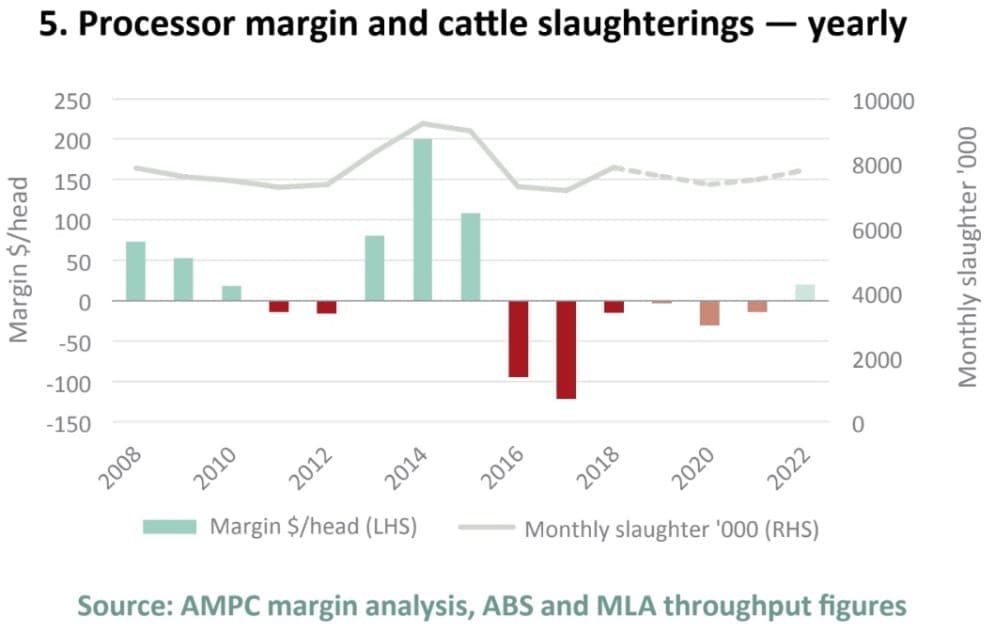
As can be seen in the graph below, since 2008, the economic performance recorded in AMPC’s representative model has varied across distinct periods of positive and negative margins, with an average monthly margin of $25 per head.
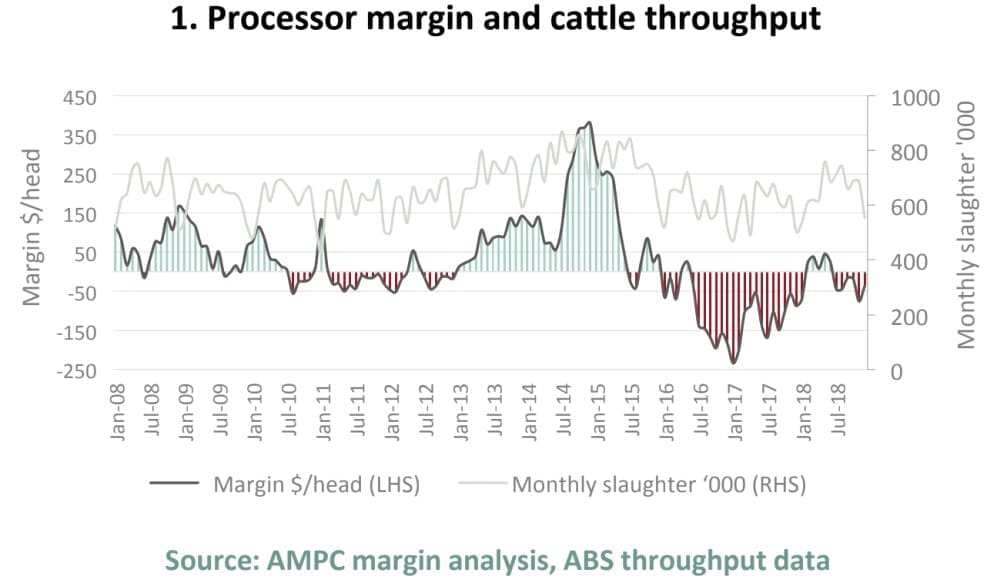
The graph above also plots monthly national adult slaughter, which is one of the strongest drivers of processor margin. Seasonal fluctuations in cattle slaughter, and the associated underlying climatic conditions, disrupt the normal long-term relationship whereby domestic cattle prices are driven by international meat prices and associated currency movements.
As such, positive margins can be seen in the graph during the ‘millennium drought’ which ended mid-2010; followed by negative margins during 2010–2012 during herd rebuild after two wet years. Positive margins arose again during the 2013-2015 drought, and as described earlier, mostly negative margins since 2016.
The strong positive correlation (76pc) between annual cattle throughput and annual processor margin is shown in the graph below.
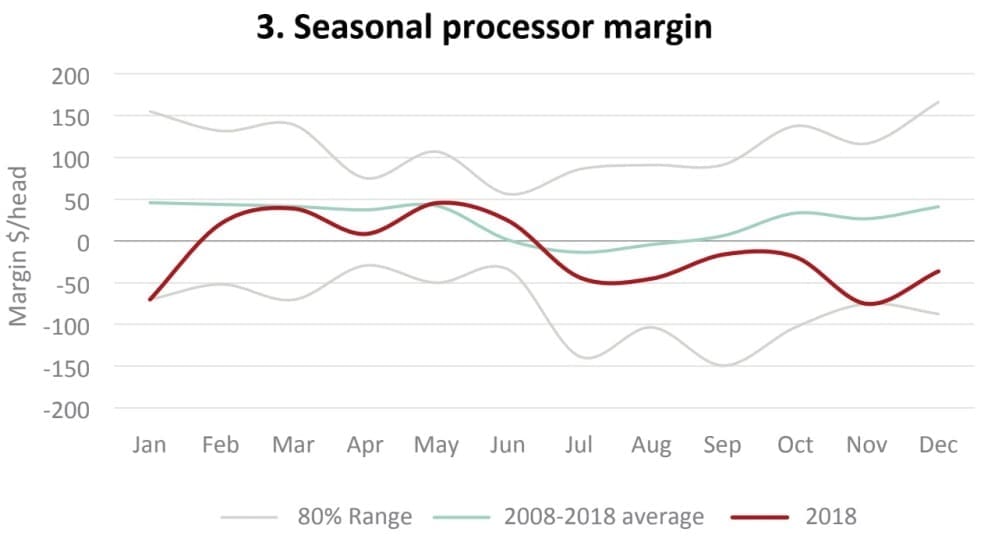
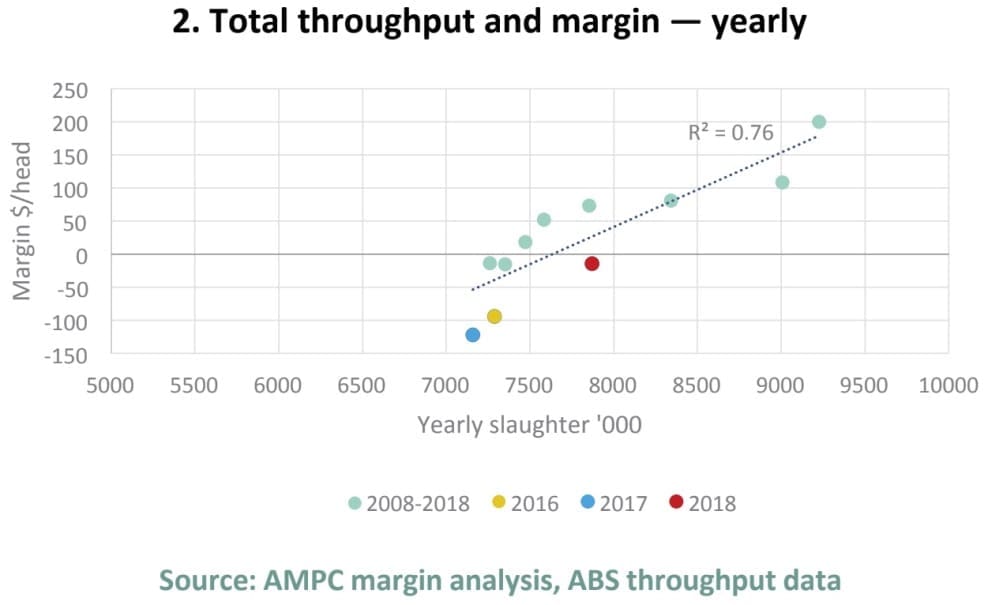 Interestingly, the 3-year period from 2016–2018 has shown a margin below what the historical relationship between throughput and margin would suggest. In particular, 2018 posted a yearly processor margin of negative $14, despite having an annual throughput on-par with the long-term average national annual slaughter of 7.8 million head. While the first half of the year did show a margin trend broadly consistent with the 11-year average (see graph below), the second half of the year did not follow the typical margin recovery.
In contrast, the Mecardo margin model showed a strong positive margin for 2018, AMPC pointed out.
“The primary reason for the divergence in the two models is that saleyard cow prices (as used by Mecardo) showed a strong dip in 2018, which was not reflected in saleyard and OTH steer prices (used in the AMPC model) or even OTH medium cow prices,” Mr Revell said.
Despite the above average female kill ratio (51pc, which is 7pc above the 11-year and long-term average), total slaughter was less than 1pc above the 11-year annual average of 7.8 million head.
“This was reflective of the status of the national herd, which had not had sufficient time to rebuild following the 2013-15 drought,” Mr Revell said.
“Compared to the millennium drought, the 2013-15 drought saw a larger reduction in national herd (-2.4 million head compared to -1.8 million peak to trough), a larger proportional reduction in national herd (-8pc compared to -6pc peak to trough), and a similar end herd size (26.8m compared to 26.6m),” he said.
However, following the 2014–15 drought, there was only a 19-month herd rebuild phase (the period with female slaughter below 47pc of total) before drought conditions and liquidation returned. This was just half the rebuild period that followed the millennium drought (37 months).
Consequently, a flush of female cattle reduced the saleyard cow price in late 2018 at the same time as an undersupply of finished cattle forced processors to offer more at the saleyards or OTH to meet market specifications.
As cattle input prices make up the largest share of processor costs (average 79pc over the last 11-years), AMPC’s weighted grassfed and grainfed steer processor margin did not reach the highs of the Mecardo saleyard cow-based processor model in 2018.
Smaller processors vulnerable
The AMPC report that accompanies the launch of its processor margin model points out that for the thirteen known cattle processing facility closures* since 2008, there is a clear relationship between periods of low processor margin and plant closures (see graph below). There were three additional sheep/lamb abattoir closures in the period.
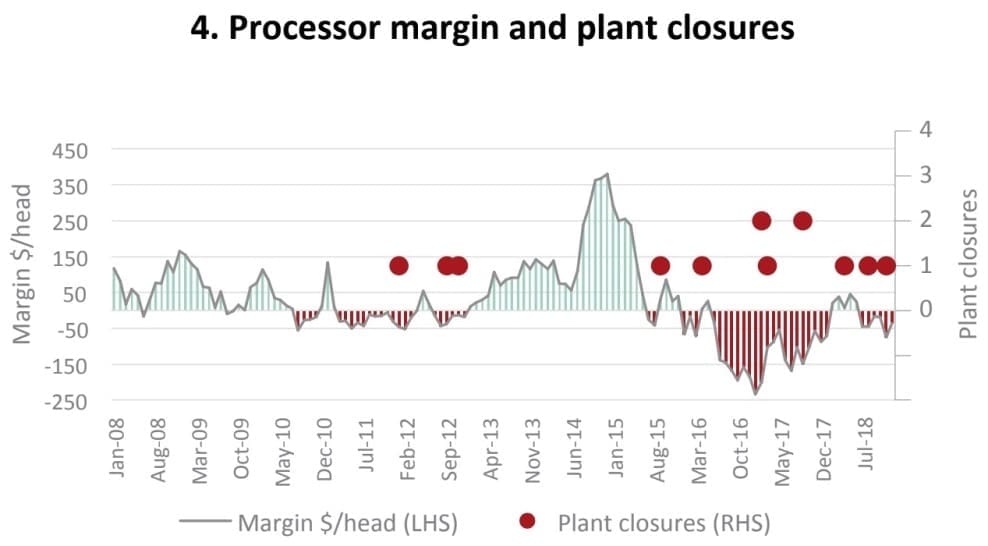
The thirteen closures resulted in the loss of 1800 jobs in the sector, and occurred primarily in regional areas. Nearly 70pc of the plant closures had less than 200 employees, and the remainder employed between 200 and 600 people.
This highlights the particular vulnerability of smaller and medium-sized processors during periods of prolonged or extreme low margin.
Previous analysis has estimated that the flow-on effects from processing is the highest in the red meat sector, with every full-time equivalent employee supporting a further 2.45–2.75 full-time equivalent jobs in the broader economy.
“As such, the permanent loss of 1800 jobs from plant closures would potentially result in a subsequent loss of 4425 to 4967 jobs up and down the supply chain,” AMPC said.
Tough three years ahead
Based on MLA’s 2019 Industry Projections forecasts, adult cattle slaughterings are anticipated to drop to 7.6m head this year (analysis made prior to recent heavy January-March cattle liquidation due to drought), and to 7.35m in 2020, before recovering to average in 2022 with 7.8m head slaughtered.
“All else remaining equal, these annual throughput levels would result in a continued negative annual margin for the AMPC representative processor until 2022,” Mr Revell said.
With processors already having sustained negative margins since 2016, this outlook scenario would result in a six-year period of negative annual margins – the effects of which would be felt not only in the processing sector, but also along the broader red meat supply chain and in the local communities on which it depends, AMPC said.
* Click this link to access list of plant closures
As the past few years has shown, the challenge for the industry is the huge swings in supply that occur. It’s not about the ‘huge profits’ being made by processors/producers at one point in the cycle, and the ‘huge losses’ they make at the opposite point in the cycle.
While it makes basic economic sense to have all meat plants operating at, or near capacity (many plants in Brazil operate two shifts daily, six days a week – effectively double the throughput of most Australian plants), that can only really happen at one point in the supply cycle.
It either means plants are sitting around idle when supply is tight (as it inevitably will be for the next 12 months), or there is nowhere near enough killing capacity to handle the available supply, as has been seen at times during the recent droughts. Feedlots can help smooth out that supply volatility, but only to a certain extent.
Unfortunately seasonal volatility will continue to plague the performance of the Australian beef industry much more than it does overseas.