“The Business of Beef ” is a regular series produced by the Bush Agribusiness team for Beef Central readers.
Rising inflation is affecting input costs right across the board at the moment. The costs of some items today seem astronomical compared to what they were in the past. We all know that old codger who reminisces on the seemingly simple times, where a Toyota Landcruiser Utility set them back less than $5,000 and a pot of beer was purchased with cents not dollars.
Inflation explains most of the changes over time and agricultural input costs increase by roughly the same as costs across the general economy over time.
Although somewhat trivial, and of not much use in making future business decisions, we think that it is interesting to understand the change in prices over the years, and what better way to do it than express the historical cost of some key items in the number of bullocks required pay for them over time; the bullock index. We have done this out of curiosity, and to counter some of the more serious analysis we provide through the year. The items (a base model Landcruiser Ute, award wages for a station hand for one year, a year’s boarding school fees and 10 pallets of beer) are expressed in bullocks over the last 41 years in the below graph. They trend somewhat similarly over time, which is a reflection of changes in the Jap Ox price, there are some differences though.
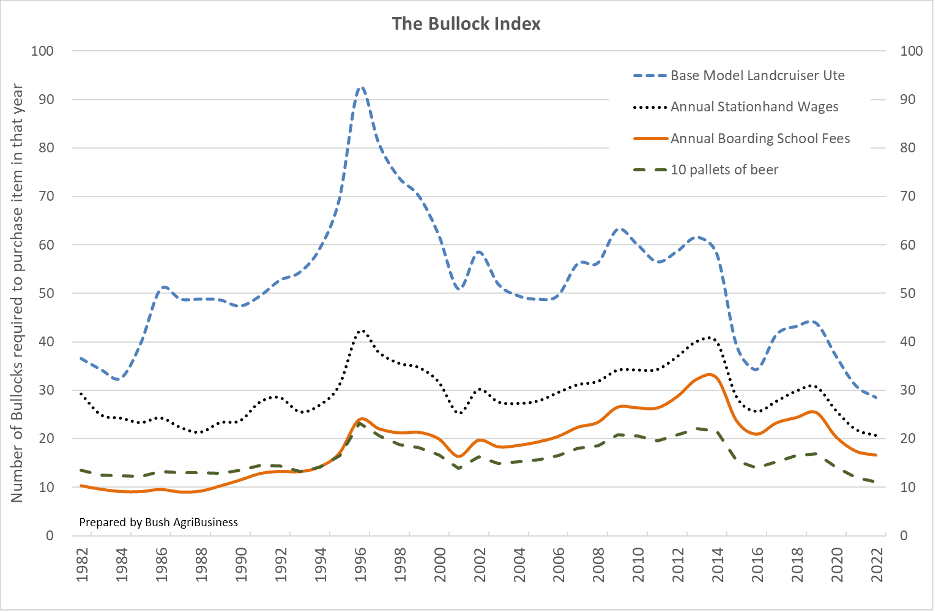
Let’s address a few things that should be considered in the analysis first;
- the Toyotas of today – if you can get one – are much more advanced and comfortable than those of 40 years ago,
- the award wage is seldom paid, however it is a reflection of the cost of labour over time,
- there are less bullocks sold off grass now than there were historically
- boarding schools’ accommodation, tucker and academic programs have evolved a lot over the last 40 years, and,
- not many of us buy beer by the pallet!
Whilst there were some increases in the middle, Toyotas, station hands and beer cost less bullocks at the end of the period analysed than at the start. School fees are a different story though, with the number of bullocks required to pay a year’s school fees nearly doubling by the end of the period, after more than tripling before the recent beef price rises.
The below graph looks at price changes in a different way, with nominal prices indexed to 100 in 1982 and then changes graphed over time. For interest, retail beef and computers have been included in this graph.
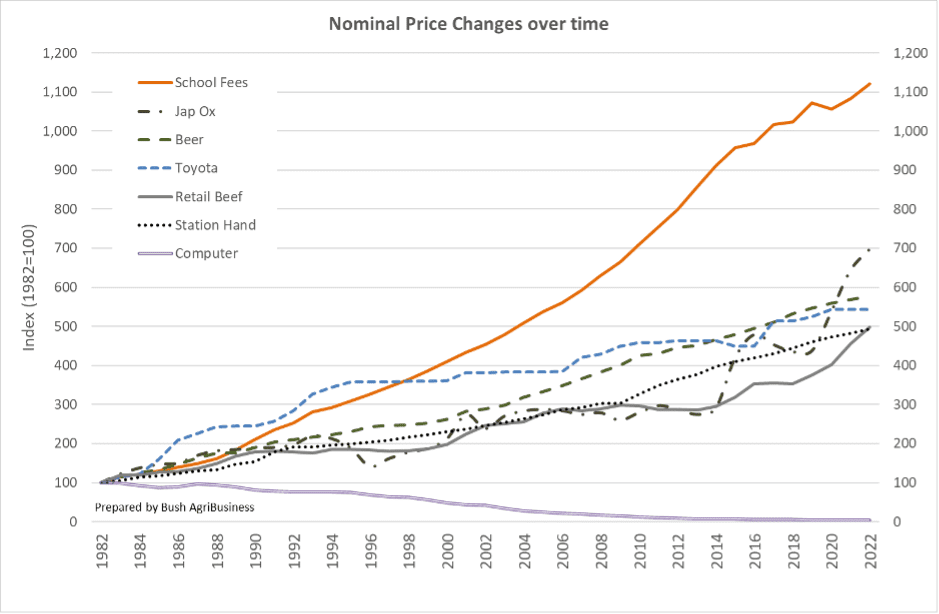
This shows that the cost of most items increased at a similar rate, the general rate of inflation, with beef prices (Jap Ox) at the top of the pack at the moment.
The outliers are school fees, which have increased at a much higher rate than inflation, and computers, which have decreased in price over time. This may provide a small consolation to parents as they set their kids up with laptops when sending them back to boarding school for the year!
Whilst all of this is interesting, focussing too much on expenses risks being a distraction in agricultural businesses, as most expenses are largely out of your control.
Improving efficiencies within your business and a continual focus on productivity will do more to shield you against inflation and price variations over time.
Source: Bush Agribusiness
Earlier articles in The Business of Beef series:
How grazing beef businesses boomed in 2022
Can wealth creation be tax deductible?
What rising inflation means for the beef industry
Capital allocation and yield compression