THIS opinion item published on Beef Central on Tuesday, Yawning gap between retail and livestock price information disadvantages producers, has attracted wide reader comment.
Indeed it currently appears among Beef Central’s Most Popular items list (click on the icon “Today’s News/Most Popular” at top left of our home page to view).
 In it, NSW beef producer and former meat sales executive Andrew Dunlop draws attention to a lack of collection of retail beef price data, which he suggests means producers have no information on what consumers are paying and what should be a fair price for their livestock.
The article and reader responses have motivated us to dig into some history on the topic that may add some context to the current discussion.
Some years ago during an industry annual general meeting, Meat & Livestock Australia committed publicly to producing a quarterly “Producers’ share of retail dollar” calculation.
Exactly when that happened is hard to determine, and none of the current cohort of MLA markets intelligence staff have been around long enough to remember. However we tracked down a former MLA senior staffmember who has clear recollection of the events. He agreed that the original request probably stemmed from the Australian Beef Association, but conceded it may have been Cattle Council of Australia.
MLA delivered on its commitment, and for the next few years, pumped out a quarterly summary of the cattle (and sheepmeat) producers’ share of the retail dollar.
Here’s a graph showing that information, tracing retrospectively from MLA’s launch in 1997 to September 2016:
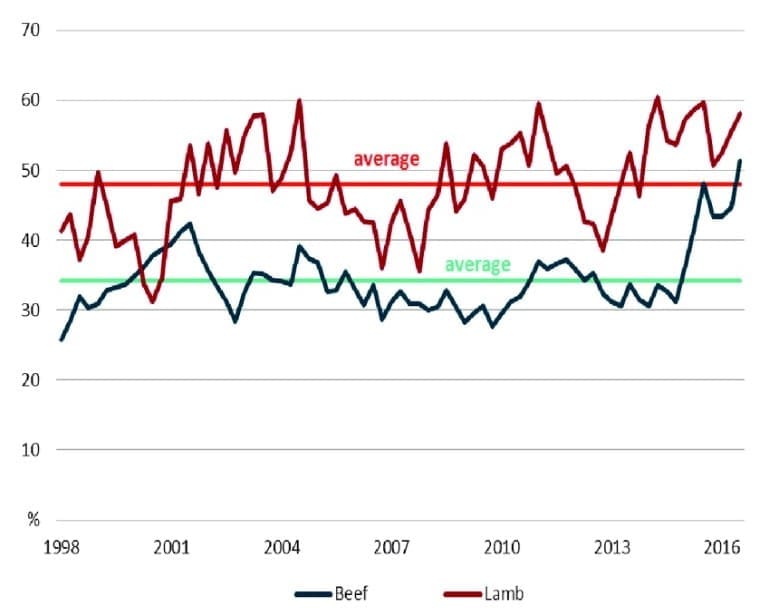
The historical average for that 19-year dataset suggested an average of 34pc share for beef producers (green line) and 48pc for lamb (red). No explanation was found for why lamb was so much higher. However what was also clear was considerable volatility. In the worst of years, beef’s share fell to around 25pc, and lamb 30pc. But in the best of times, beef share to producers soared to well above 50pc, and lamb 60pc.
Lack of interest
But then, in September 2016, MLA’s retail share report stopped. The reasons were not made clear at the time, but cost, and level of stakeholder interest, were put forward as possible factors.
Others who were part of the information-gathering and calculation process at the time, but who have since moved on from employment at MLA, said the project “Just died on the vine,” through lack of interest.
“There might have been five stakeholders who were interested, but nobody else cared,” he told Beef Central.
He made the point, however, that cattle producers appeared to only ever show interest in ‘who’s getting the share of the retail dollar’ during times when cattle prices are perceived as low (like now.)
“Nobody was asking about share of retail dollar over the last two years, when cattle prices shot to record highs, and both processors and retailer margins were cut to nothing – and in many cases negative,” he pointed out.
We’ve managed to dig out some commentary, published below, provided with MLA’s original ‘share of retail dollar’ reports, describing their purpose and how they were calculated. We understand the exercise was relatively simple and straightforward, for anybody with an economics background:
The beef and lamb producer shares of the retail dollar are calculated using a range of assumptions. The national saleyard trade steer and trade lamb indicators are used as the benchmark livestock prices, representing animals suited for the domestic market. Livestock prices are collected by MLA. Converting the carcase weight price to an estimated retail weight equivalent price is achieved using a retail meat yield for beef and lamb of 68.7pc and 70pc, respectively.
The indicative retail meat prices are calculated by indexing forward actual average beef and lamb prices during December quarter 1973, based on meat subgroup indices of the Consumer Price Index, provided by the Australian Bureau of Statistics (ABS). These indices are based on average retail prices of selected cuts (weighted by expenditure) in state capitals. The retail price calculation has principally been made by ABARES, however in some instances, the most recent calculation has been made by MLA.
The producer share is calculated by dividing the estimated retail weight equivalent livestock price by the indicative retail price.
Retail price reports
 Independent of the quarterly share of retail dollar reports, MLA for years also routinely published a regular weekly or fortnightly wholesale/retail beef prices report for a range of different cuts. This appeared in the old weekly Meat the Market bulletin. That service appeared to have been discontinued some time around 2015 or 2016.
Today, MLA’s website simply provides a graph for ABS’s quarterly retail figure for a whole beef carcase. Click here to access. Editor’s note: When the original version of this item was published, it suggested the entries were out of date. That has either now been resolved, or there was a cacheing problem on our PC, displaying an out of date version.
The Australian Meat Industry Council, representing independent butchers and processors, has never engaged in meat price reporting, to Beef Central’s knowledge.
Beef Central itself does do an occasional report on wholesale and retail Australian beef prices on selected items (click here to view recent example), but the series is only a snapshot of a few items (typically rumps, rib eyes, briskets, trim) and published infrequently, at best.
US focus 0n cutout
So what happens in this space overseas?
The US beef industry, through the USDA Agricultural Marketing Service (heavily financially supported by the US government), routinely reports on a range of retail and wholesale US beef cuts values, as well as producing a series of daily boxed beef cutout values.
This is part of a compulsory reporting system for all products in the beef supply chain, from feed supplements to retail beef sales.
The boxed beef cutout represents the estimated gross value of a US beef carcase based on prices paid for individual beef items derived from it. Two separate cutout values are produced daily, for USDA Choice and Select grade carcases. Historical data is available on USDA’s DataMart website.
How does the US cutout work?
The US boxed beef cutout calculations begin with determining a current two-day weighted average price for each beef cut, plus trim. The current prices from the individual item section of the report are combined with the prices from the previous day to create the two-day weighted average price for each item. The two-day weighted average prices, along with industry cutting yields, are used to calculate sub-primal style values, which are then calculated into primal values. The primal values are factored against their yield from the carcase, and the resulting values are aggregated into the final carcase cutout values for USDA Choice and Select grades.
The USDA Agricultural Marketing Service has published this useful users’ guide to USDA’s Boxed Beef Cutouts.