In collaboration with analysts Episode 3, Beef Central in July launched a new quarterly series looking at trends in the beef producer’s typical share of the retail consumer’s spend on beef products.
A similar analysis was compiled by Meat & Livestock Australia for four years, before being discontinued by the industry service delivery company back in December 2016. The project was originally launched during the 2012 MLA annual general meeting.
Beef Central sought, and gained MLA’s approval to resurrect the discontinued series, based on clear reader interest. The same formula is used to compile the new set of results as originally used by MLA (see explanation at base of page).
 Episode 3 and Beef Central now jointly publish a report each quarter, soon after ABS quarterly retail beef price data is released. This typically happens around late July, late October (today’s report), late January and late April. Click here to read our first report in the series, published three months ago.
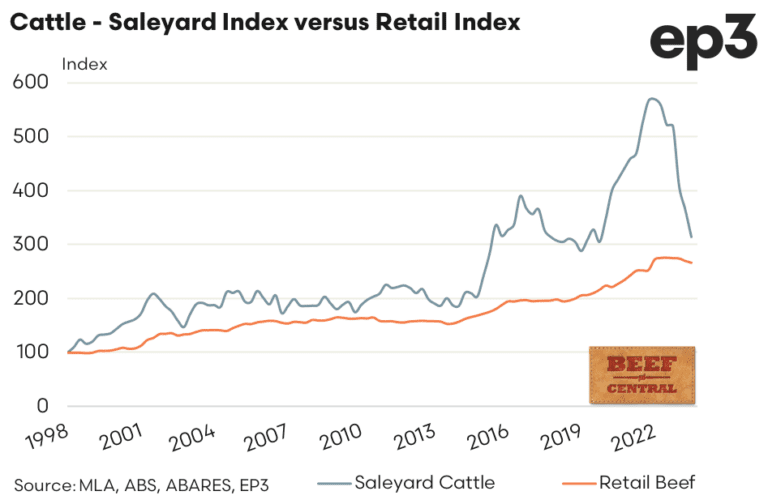
The exercise sees national saleyard cattle prices in carcase weight terms being converted into an estimated retail weight equivalent and compared to average retail beef prices, as reported by ABS.
September quarter result
Since our last update (from the June quarter 2023) the cattle saleyard index to the end of September has dropped a further 14 percent from 365 to 314 (see graph above). Meanwhile at the retail level, the beef index has eased just 1.2pc from 269 to 266.
In terms of retail dollars per kilo average, beef prices have eased from $26.51 to $26.19 over the past three months.
Share falls to lowest level since 2010
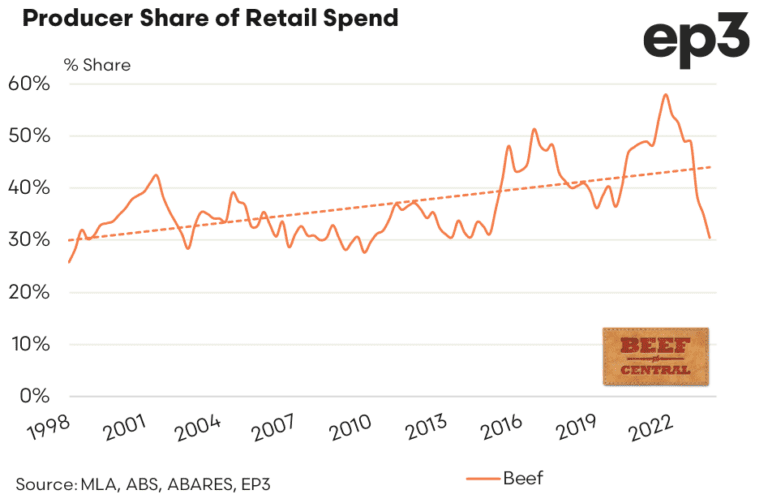
As cattle saleyard price falls continue to outweigh retail price declines, the beef producer share of the retail spend continues to track lower too. The producer share of the retail spend on beef has dropped from 35pc in the June quarter to 30.5pc for the September 2023 quarter.
This represents the lowest the producer share of the retail spend on beef has been since the first quarter of 2010, when it dropped to 29.6pc (see graph). However, there were a few times this point was nearly breached, in Q1 2014 and Q2 2013, when the share got to 30.6pc.
About the producer share of retail calculation
The beef producer share of the retail dollar is calculated using a range of assumptions. The national saleyard trade steer indicator is used as the benchmark livestock prices, representing animals suited for the domestic market. Livestock prices are collected by MLA’s NLRS. Converting the carcase weight price to an estimated retail weight equivalent price is achieved using a retail meat yield for beef of 68.7pc.
The indicative retail meat prices are calculated by indexing forward actual average beef prices during each quarter, based on meat subgroup indices of the Consumer Price Index, provided by ABS. These indices are based on average retail prices of selected cuts (weighted by expenditure) in state capitals.
The producer share is calculated by dividing the estimated retail weight equivalent livestock price by the indicative retail price.
 Episode 3 (EP3) is an independent, data-driven market analysis service that provides premium insights and reports to the agriculture industry, food manufacturing sector and their associated markets. Through robust analytical assessment, EP3 assists agricultural stakeholders to make better, more informed decisions that drive profitability. The company is experienced in producing high-quality reports used by government, RDC’s and corporate entities. In addition, EP3 is available on a retained basis with clients to provide on-going and bespoke information to assist in their sales or purchasing process. Click here to access the Episode 3 website.