 Meat and Livestock Australia launched a new tool to help gauge the state of health of the industry during the producer company’s annual general meeting in Fremantle on Thursday, but warned that it should not be used in isolation from other data.
Managing director Scott Hansen announced the release of the new metric, based on producer share of retail expenditure.
Such a measurement has been called-for for some years by industry lobby group, the Australian Beef Association, as a useful gauge of industry and MLA performance.
During his AGM presentation, Mr Hansen highlighted that while volume of beef sold on the domestic market had changed little over the past decade, the value of beef sold into the domestic trade had increased 16pc, or $850 million since 2003.
“That growth in value raises the question of how much of this retail consumer dollar the producer sector gets,” he said.
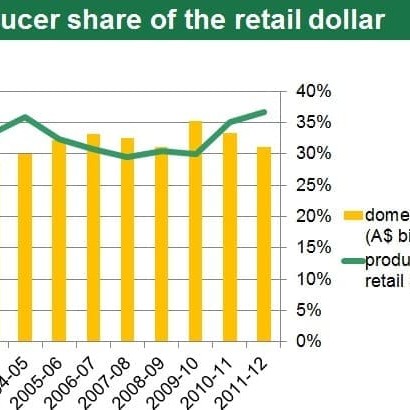
Thursday’s launch of the data set, which will be tracked annually from now on and will be presented at future AGMs, had produced an estimate of 36.6pc for 2012. This contrasted favourably with a 30.4pc figure for 2003, when MLA last held its AGM in WA. But there has been obviously been considerable volatility in between.
“It’s one of the annual figures that we can produce to help the industry keep a track of its state of health,” Mr Hansen explained.
The new measurement joined a key set of metrics that were important to the industry, Mr Hansen said. These included the strength of the A$; domestic consumption figures; export value and volume; and cost of production figures, produced by ABARES. Volume of livestock exports could also be added to that list, some would argue.
He warned, however, that the share of retail expenditure figure itself was probably less important than the trend in the figures over time.
It is the trend that best told the story of what is happening in that relationship between farmgate prices and the prices consumers are paying for their beef.
Applying a yearly ‘pass’ or ‘fail’ mark to the figure would be difficult – again, because the trend was more important in monitoring where the industry was positioned.
“It may reflect additional costs imposed post-farmgate, in the processing sector and transport and retail, for example, which might erode that figure over time. It may also reflect whether consumers were willing to pay more for the benefits they saw in beef brands being developed by producers and others in the supply chain,” Mr Hansen said.
“However we think it will give us (MLA) a powerful additional tool on which to base our investment strategies, as well as allowing producers to add to the other measurements they already have to gauge the health of the industry.”
He said the development of the measurement had come as a result of discussion and feedback from MLA levy payers, about what additional information they needed to better assess how the industry was going.
“As an additional tool to the existing industry benchmarking figures, the retail share measurement provides a trend gauge which will help us to assess what is happening along the supply chain that is influencing the final outcome.”
US share considerably higher
By way of comparison, the US beef industry’s share of the consumer dollar is currently around 51pc, but MLA has not yet broken that calculation down to determine whether the math is similar to that used in the Australian example.
While the US calculates retail share monthly, it did this with the luxury of mandatory price reporting, making the process convenient, cheap and transparent.
Even the US monthly figures this year went from 47pc to 53pc share, showing the inherent volatility in such a measure, driven heavily by cattle price.
Post-farmgate processing costs in the US industry are widely known to be significantly lower than those in Australia – sometimes half.
“That obviously increases the percentage of the consumer dollar that is able to be passed back to the producer. We also know that the vast majority of the US product is consumed domestically, avoiding any currency impact, and reducing the cost-of-supply chain in servicing a large domestic marketplace” Mr Hansen said.
It was also likely to be impossible to make realistic country-to-country comparisons, from such calculations, because circumstances were so different, he said.
“But what it does allow the Australian industry to do is to ask the questions: why are there differences in certain areas, and changes year-on-year, and how might we improve them?”
“We need to concentrate on what can be done to ensure that as much of that consumer dollar as possible passes back to the farm-gate, allowing producers to re-invest in their production systems to keep feeding the Australian and global population.”
“But obviously anything that reduces the cost between farmgate and the consumer’s point of expenditure is potentially going to allow for greater flow of that share back to the producer,” he said.
 MLA senior analyst Tim McRae said numerous countries already compiled a similar figure, including New Zealand, Ireland and the US.
“But it’s important to realise that this is not a ‘one-stop, ready-reckoner’ for the performance of the Australian beef industry. We have to be careful how we interpret the figure,” Mr McRae said.
“There is a lot of economic literature that says retail share can be a weak indicator of performance. It is a contributor – just as cattle price and export values for the year are contributors.”
Mr McRae said because retail beef prices were so ‘sticky’ (less variable, due to retailers desire to maintain pricing consistency), the retail share measure calculation was much more influenced by cattle price movement.
Cattle price, as a contributor could easily jump 15-20pc over a yearly cycle, whereas retail beef price was much less volatile –often shifting only 0-2pc within a year.
Mr McRae said some people might be surprised to see the highlighted change (30pc to 36.6pc) in retail market share since 2003, but this largely reflected the movement in cattle price over the period, and especially in 2011-12.
Similarly, using other single gauges to measure industry performance could be fraught with danger.
“Judging industry performance on export volume – almost a record this year – would suggest 2012 has been a lot better than it is, because those volumes are not transferring to prices. Do it solely on cost of production, and the influence of drought or a big season can have a big effect. Similarly, using the value of the A$ as a barometer of industry health, would suggest a big cross, instead of a tick, this year.”
“But listening to outlooks presented during the AGM, the industry is still doing pretty well, in areas like export value and domestic expenditure, so the A$ in isolation does not provide a reliable picture.”
Mr McRae said it wasn’t like a football club where a single result – where it finished on the ladder – gave a fair indication of whether it was a good or bad year for the industry.
“Instead, a report card approach is the better option, where a mark is provided against a range of metrics – retail market share being just one – and a conclusion drawn from that,” he said.
Asked whether there was any merit in doing the calculation more frequently, Mr McRae said the ABS retail price data was only produced quarterly, and even then could be ‘all over the shop.’ A fiscal year calculation smoothed-out some of that volatility.
He said the long-term aim was to see the producers’ share of retail higher, because that would largely mean cattle prices were higher.
“Despite its contribution, I don’t think anybody should be tempted to make management decisions based on this information alone. It is simply another part of the report card.”
“It provides some insight, but not to the degree of importance that some stakeholders have placed their faith in,” Mr McRae said.
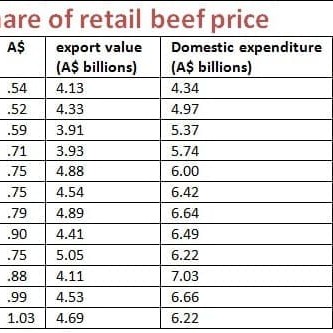
The new retail share value is based on the NLRS trade steer price, transferred into a saleable meat yield, and then divided by the retail price, based on Australian Bureau of Statistics data.
Part of the reason the data had not been more widely circulated previously was the risk of misinterpretation. For that reason, the annual release of the figures will come with a series of explanatory notes.
MLA’s Dr Peter Barnard said he still expected retail market share to bounce around quite a bit, year to year, as was illustrated in the graph on this page.
He thought the retail share figure might be useful in indicating changes in efficiencies over a long period of time – perhaps ten years plus – but he, too, warned over year-to-year assessment.
“Over that longer-term perspective, you’d hope to be washing some costs out of the system,” Dr Barnard said. “There’s numerous ways to achieve that – government investing in infrastructure, lowering taxes and charges, and private enterprise investing in efficiencies.”