THERE is an old saying that the value of a beast is 90 percent nutrition and 10 percent genetics.
Results from Cohort Four of the Angus Sire Benchmarking Program (ASBP) would challenge that assertion.
In this program, about 35 young Angus bulls are used by AI in commercial herds each year and the steer progeny are then backgrounded together before being fed for 100 days in the Tullimba Research Feedlot at Armidale, where feedlot performance including Net Feed Efficiency is measured.
The steers are then fed for a further 200 days at the Rangers Valley feedlot before slaughter at John Dee Abattoirs near Warwick, where extensive carcase measurements are undertaken including laboratory measurement of tenderness, moisture loss and intramuscular fat percentage.
All carcases are Meat Standards Australia graded.
Each young sire is randomly mated to the available females in each progeny test herd and adjustments are made for variation in the number of steer progeny in each herd. The steers are then treated as a single mob during backgrounding and lotfeeding and all slaughtered on the same day, so the differences in measured carcase traits are due entirely to genetic differences between the sires.
In Cohort four, only 21 young sires were used, but the variation between the average value of progeny of the best and worst performing sires in Cohort four was $619.
On an individual carcase basis, the difference between the highest and lowest valued carcase was $2076.
The progeny average carcase values were derived by applying current day industry based parameters to each of the 283 steer carcases from Cohort 4 of the ASBP. The parameters are based on a general long-fed production system (200+ days) with the aim of producing and selling high quality Angus beef products. The specific parameters applied were:
- $8/kg carcase weight for a AusMeat marbling score 3 carcase
- Add 40c/kg carcase weight per Ausmeat marbling score above 3.
- subtract 80c/kg carcase weight per Ausmeat marbling score below 3
- Subtract 10c/kg carcase weight if >25 mm but less than 30 mm p8 (i.e rump) fat
- Subtract 15c/kg carcase weight if 30 mm of p8 (i.e rump) fat or greater
Additionally, progeny average values, including Carcase Value ($), are calculated using a least squares means (LSM) model, which takes into account herd and other contemporary group effects.
As expected, the sires with the highest carcase value progeny averages had progeny with higher carcase weights, coupled with higher marbling scores and rump fat in the optimum range. For example, the sire ranked first with a carcase value progeny average of $3511 had an average carcase weight of 423kg, an average MSA Marbling Score of 581 and an average Rump Fat of 15.4 mm.
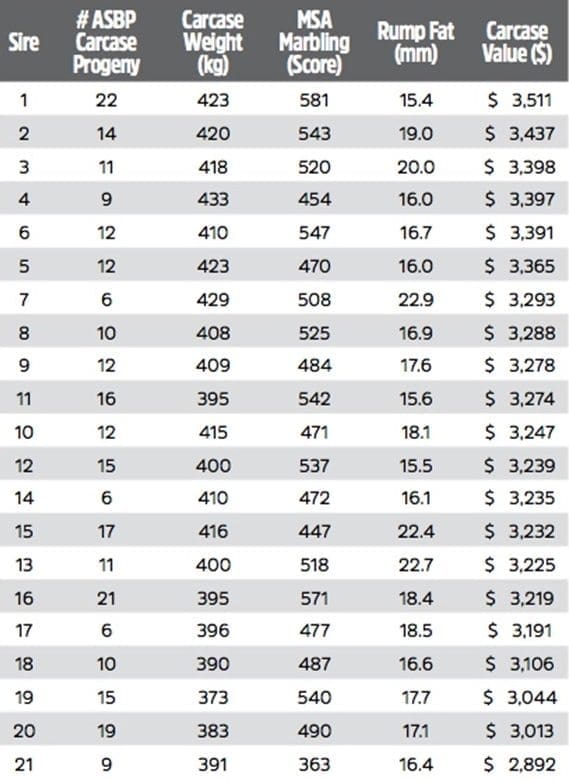
Table 1 – Progeny Average Values for the Cohort 4 ASBP Sires Sorted in descending order by Carcase Value ($)
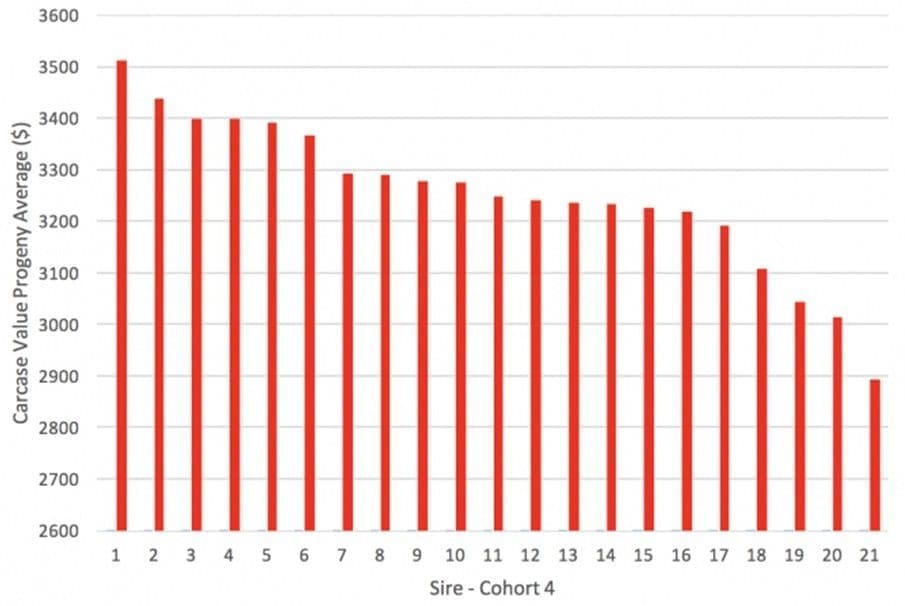
Cohort 4 ASBP sires carcase value progeny values ($)
What is the ASBP?
The Angus Sire Benchmarking Program (ASBP) is a major Research &Development initiative of Angus Australia with support from MLA and industry partners such as Vetoquinol, Rangers Valley feedlot and John Dee abattoir. The objectives of the ASBP are:
- To generate progeny test data on modern Angus bulls, particularly for hard to measure traits such as feed efficiency, abattoir carcase measurement, meat quality attributes & female reproduction.
- To generate data for the validation & refinement of Angus BREEDPLAN.
- Build a comprehensive phenotype & genotype database on Australian Angus for genomic technology validation, research & development.
The time from selecting the young sires (which are identified as potentially high performing sires based on their EBVs and Indexes) until slaughter is approximately three years. While Cohort 4 has now been completed with the slaughter of the steer progeny, 35 sires for Cohort 8 of the ASBP has now commenced.
- More information about the ASBP can be found on the Angus Australia website www.angusaustralia.com.au by clicking on “Benchmarking”
- See today’s accompanying article: How well do EBVs of young bulls predict the differences in performance of their progeny?
I’ve never heard 90:10 (nutritional vs genetic contribution) when it comes to carcase value.
The rule of thumb (as used by most respected livestock consultants, ag scientists, etc) is that phenotype (ie the performance of the animal, and what we get paid for) is a function of 30% genotype and 70% environmental factors (namely nutrition and management).
Hence the reason those in commercial livestock production (as opposed to academia) place minimal attention to industry-wide claims around dollar value for “genetic merit”. The theoretical millions often quoted around “genetic merit” modelling are almost certainly never realised across the full bell curve of an industry. Please note: I’m not questioning the value of genetic investment, but it’s not a free lunch, and in many cases there are more important rate-limiting factors in a business before needing to take out a loan to buy the best bull or ram.
While the article above points to the clear advantages yielded largely from a genetic basis in the confines of (the fully-controlled environment in) a feedlot, don’t forget that an above average manager with “average genetic merit” livestock will consistently outperform an average manager with “above average genetic merit” livestock.
I would always urge caution getting too infatuated with genetic merit in advance of ensuring people have the core management skills to fully capture the benefits of their sire investments. If in doubt, just ask the dairy industry…
Cheers Gus. Thanks for your thoughts. What a great collection of industry thinking this topic has garnered from readers. Beef Central appreciates such reader comments, adding perspective and texture to the topics we touch on.Time and resourcing often means it is impossible for us to cast the net more widely in capturing a broader spectrum of opinion on such industry topics, but reader comments contribute greatly in this space. Editor
The real/quantifiable benefits of genomic testing are rapidly approaching and coupled with greater transparency in the supply chain [this must happen] will see greater returns to producers who maximize their productivity using the full suite of genetic tools along with other management practices.
Yes I agree and that is what I said. I was questioning the usefulness of the stated $2076 difference between individual animals.
David,
Your comment reinforces how in a vertically disjointed supply chain with thousands of players it is near impossible to capture value. A crush-side genomic test for tenderness (yes there are tough Angus) and marbling would be a great help but may be some time off. If carcase value is difficult, how will breeders selecting for feed efficiency capture value?
30 years ago the Angus Society decided that beef quality was the direction forward and there was a commitment to provide the tools for the breeders. It has paid off handsomely for the breed though as you point out it is still missing at the individual carcase level. The value therefore comes indirectly so it seems that’s the way of it in the short term………………….
A wonderful article. Paying attention to carcass composition is vitally important in the beef industry and the value differences are impressive. But I note that you state that on an individual carcass basis the greatest difference in value was $2076. I think this extreme range, while true, is misleading. The maximum difference between the highest and lowest lot is $619.00 and this is a more meaningful measure. Further a rough calculation reveals that the Standard deviation is +/- $106.00 meaning that two thirds of the lots averaged within $106 of the mean.. Progress is slow–which makes it all the more important to gather and use this information.
Thanks for your comment, Charles. The $619 variance mentioned in the article refers to differences between progeny groups representing the different sires tested – not individual animals. Editor.
It is good to see this information reaching a wider audience. High marbling steers are profitable for the people selling the meat – but not necessarily those selling the steers. Steers from these sires would probably receive the same cents/kilo when sold – whether in the sale yards, on AuctionsPlus or privately off farm.
Until marbling potential BEFORE slaughter for individual steers can be measured, and is paid for, there will be little incentive for breeders to produce higher marbling steers. The only way that this is likely to happen is when some test based on the genomics of the individual steer is available. I think it could be provided now for at most $50 – in five years time it could be $20.
How cheap will the test have to be for it to be worthwhile for us to identify the potential high marbling steers? And what happens to the low marbling Angus steers when that happens.
David Murray
Kilburnie Angus
Walcha NSW