Over the past two weeks, conditions for herbage mass have been very favourable across the eastern half of NSW, Qld and much of Victoria.
The ongoing improvement has seen much of the country now meeting the average or above average seasonal deciles for January.
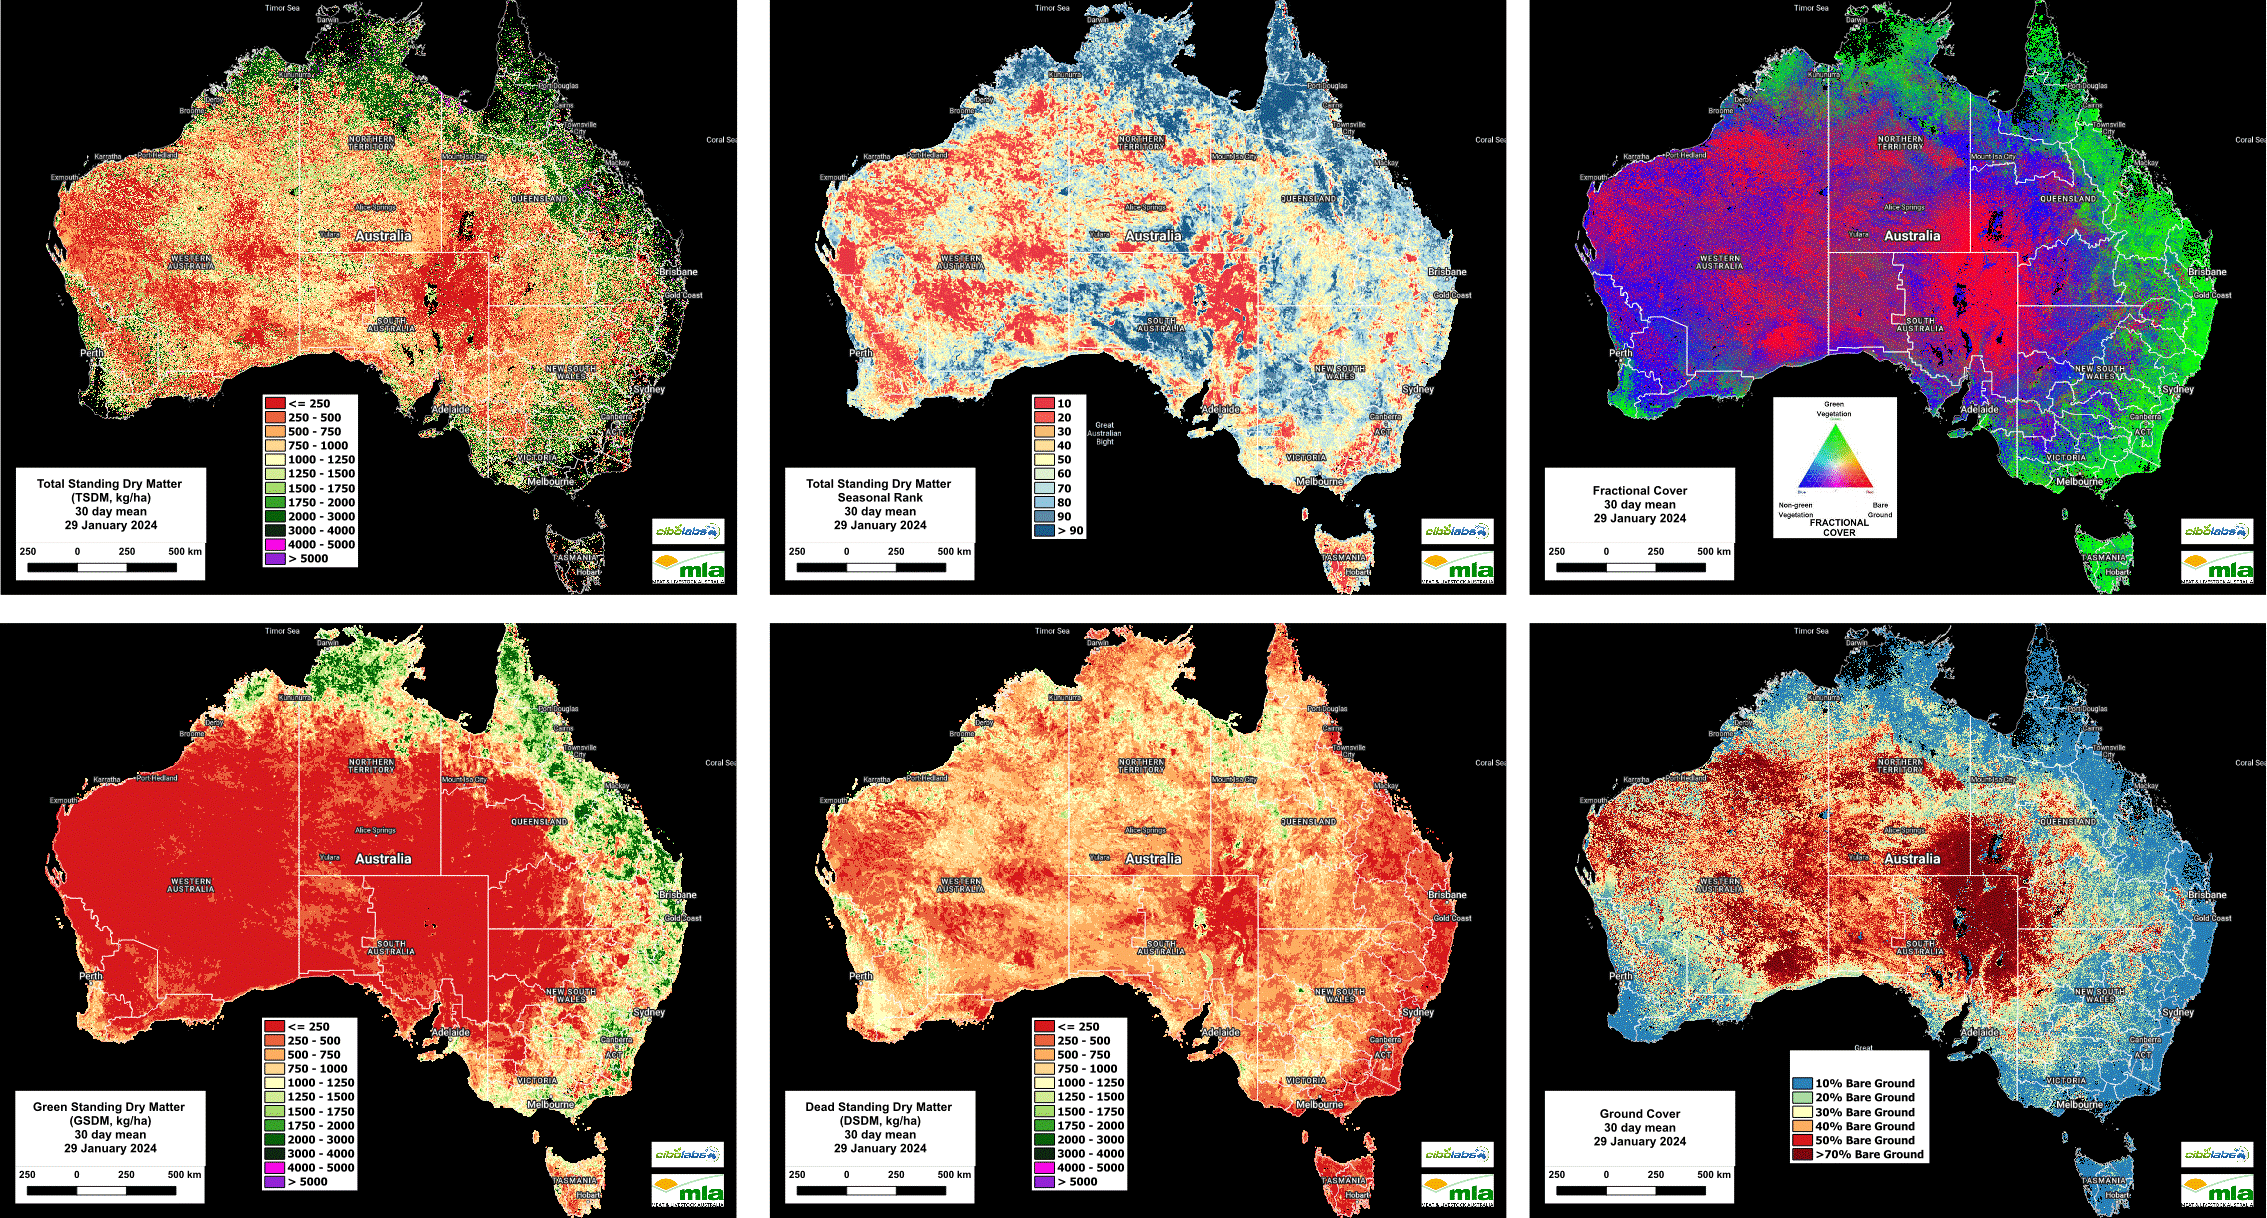
Total Standing Dry Matter
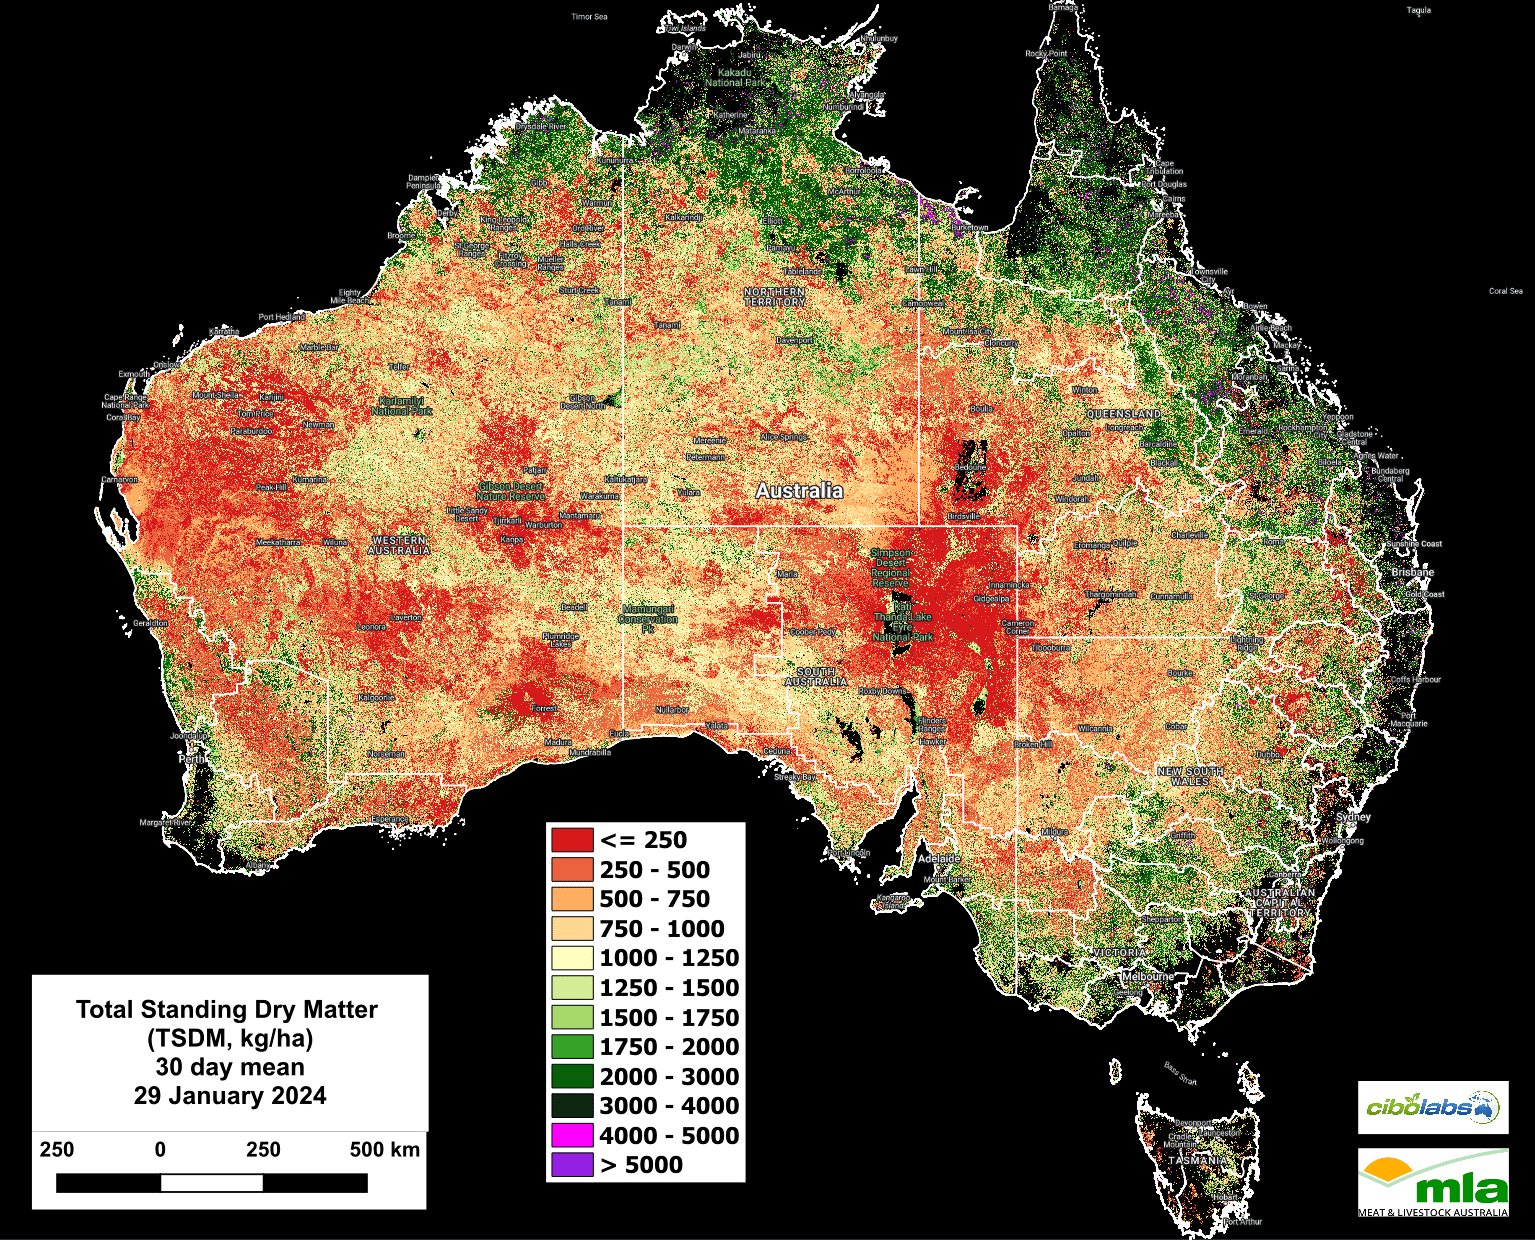
Image 1 – Total Standing Dry Matter (Kg/Ha)
Although conditions for growth have been favourable, levels of Total Standing Dry Matter (Kg/DM/Ha) have remained stable or have slightly decreased in the later part of summer. Hot conditions in inland NSW, Queensland and Victoria have seen total amounts fall slightly as herbage mass detaches in response to conditions.
Imagery and analysis provided by CiboLabs
Although many of the areas in eastern & southern NSW, as well as most parts of Victoria have reasonable amounts of TSDM much of these areas have declined to the 1200 – 1500kg/DM/Ha range.
Seasonal Comparison Total Standing Dry Matter
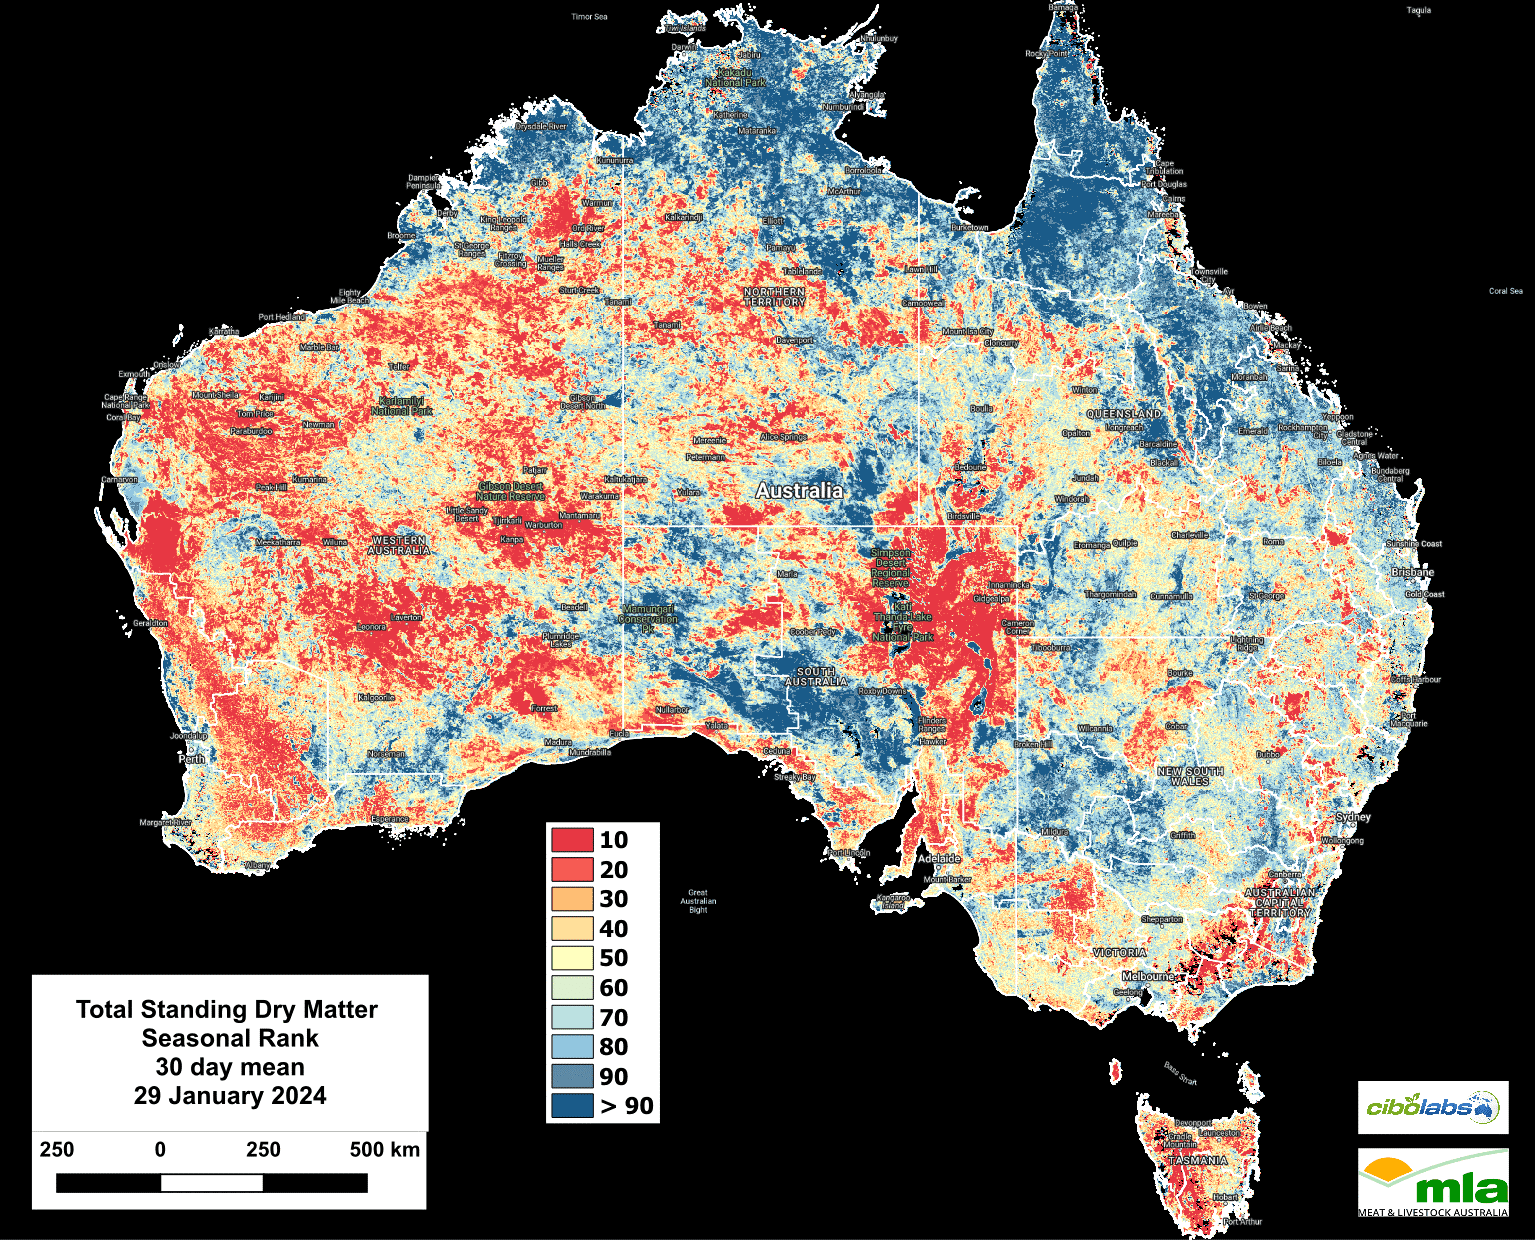
Image 2 – Seasonal Comparison Total Standing Dry Matter
Seasonal Ranking for the nation continues to reflect the recent trend of improved growing conditions.
Although some areas of the country have seen a slight fall in TSDM, this has not been sufficient to significantly alter the rankings for many regions.
Much of North Queensland, southwest NSW and through southern South Australia remain well above the seasonal average. (Figure 2).
Fractional Cover (Growth)
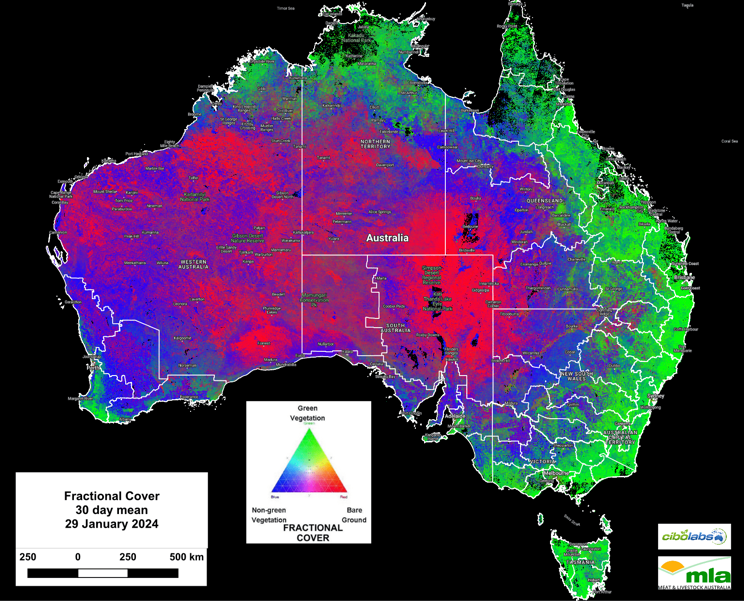
Image 3 – Fractional Cover
Assessing actual herbage growth through Fractional Cover (Image 3) highlights a significant expansion in regions where strong trends are evident.
Almost the entire eastern seaboard and adjacent regions from North Queensland to Tasmania can be seen to have high levels of actively growing herbage.
In northern Australia the impact of the wet season is noticeable with an expansion in growth areas in the Top End and across the Kimberley region.
Green Total Standing Dry Matter
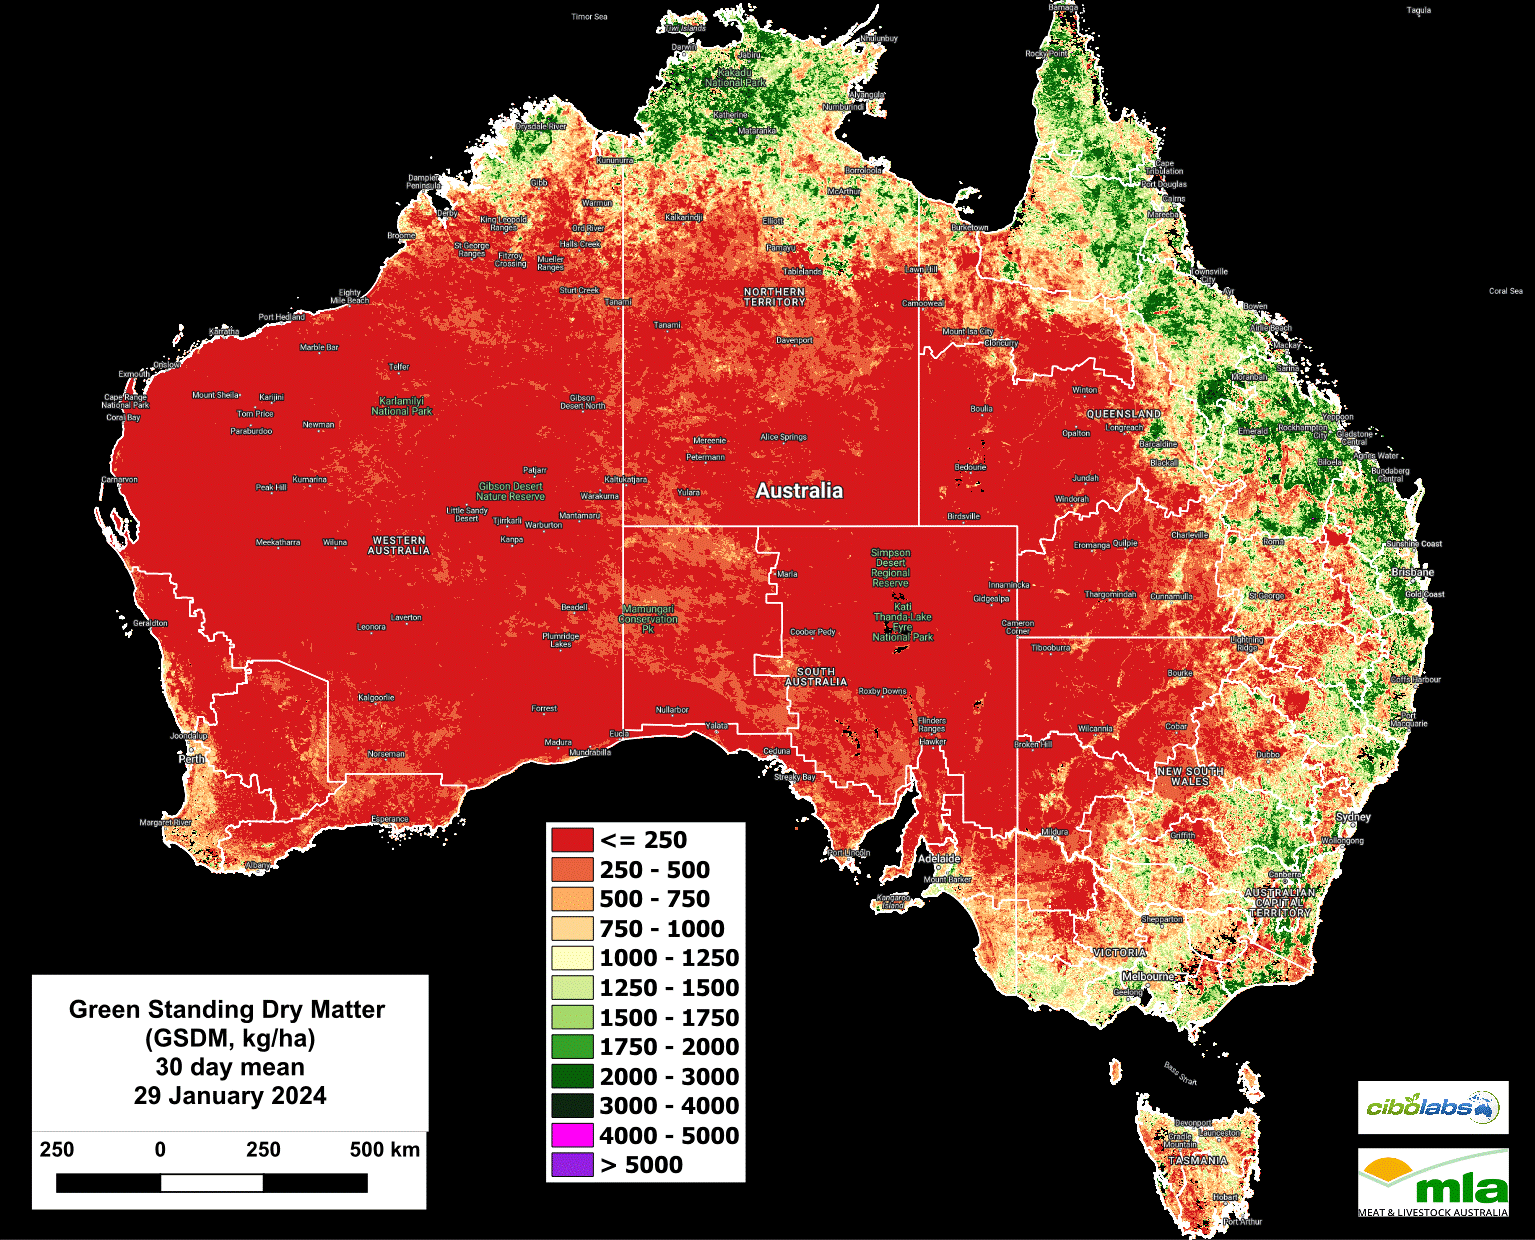
Image 4 – Green Standing Dry Matter
Green Standing dry matter reflects both the seasonal deciles and fractional Cover images.
The amount of Green Standing Dry Matter in the NSW Northern Tablelands, Lower Hunter & mind North Coast, and the Central West falling comfortably in ranges of 1250 – 2000kg DM/Ha.
Further north into Queensland similar and higher levels of green standing dry matter extend from just south of Bundaberg to Townsville and west to Emerald.
In the southern states, Victoria reflects a range of conditions, with good levels of green dry standing matter in central regions and Gippsland but declining rapidly into the Mallee.
South Australia and much of Western Australia have low levels of green standing matter contributing to the total amount available. (Image 4).
Dead Standing Dry Matter
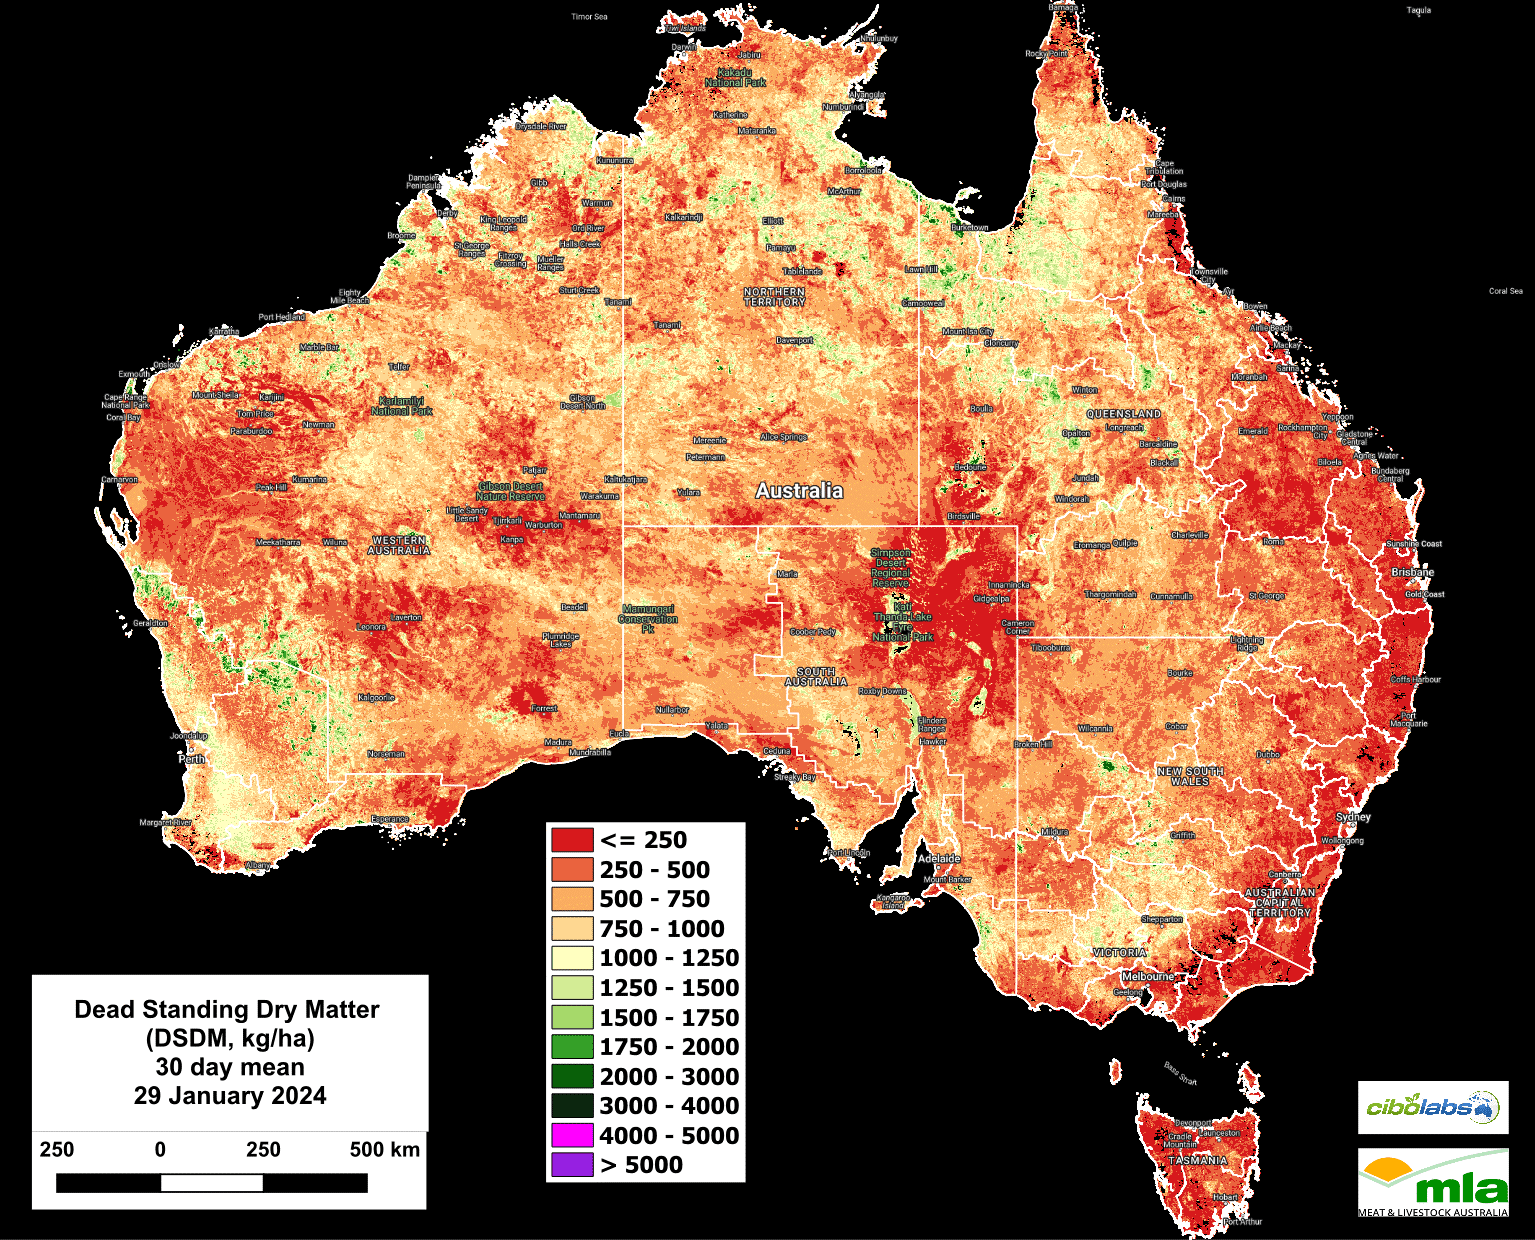
Image 5 – Dead Standing Dry Matter
Dead Standing Dry Matter levels remain largely unchanged.
Most of the country has recorded levels of Dead Standing Dr Matter to be at or below 500kg/DM/Ha.
The exceptions are areas of dead material that remain as carry over along watercourses in north and central Qld, southern NSW, the Flinders Ranges in SA and along a line extending from north of Geraldton to west of Kalgoorlie in Western Australia.
Monthly Ground Cover levels
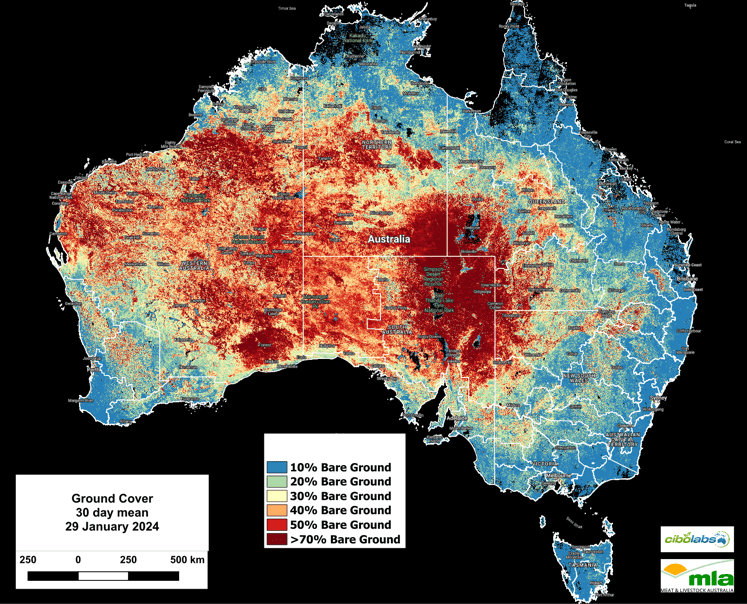
Image 6 – Ground Cover
National Ground Cover levels (30-day rolling average – Image 6) continue to improve in Western Australia with areas moving from 40% bare ground to 30% bare ground.
This improvement Is welcome through the Pilbara and Gascoyne regions. In the eastern states, ground cover levels remain reasonably stable.
For more localised information including regional level overviews, users are encouraged to explore the Cibo Labs Regional Comparison. This tool provides regional data that may show the impact of localised weather or fire events. A further level of detail for individual properties is available for users who have created an Australian Feedbase Monitor account, which can be accessed both through the MyMLA portal or through the Cibo Labs website.
The Cibo Labs National Comparison can be used to freely access these layers (https://www.cibolabs.com.au/products/national-comparsion/) to view the most recent images from a national, state or catchment level.
This tool can complement the Australian Feedbase Monitor which can also be created within the Cibo Labs Web Site www.cibolabs.com.au


HAVE YOUR SAY