Ongoing rainfall across eastern Australia has contributed to continued herbage growth in all of the eastern states.
Herbage mass levels in NSW, QLD and Victoria have significantly increased in recent weeks.
Hot and dry conditions in the western portion of the continent have had a detrimental impact on herbage mass and on ground cover in many regions.
Total Standing Dry Matter
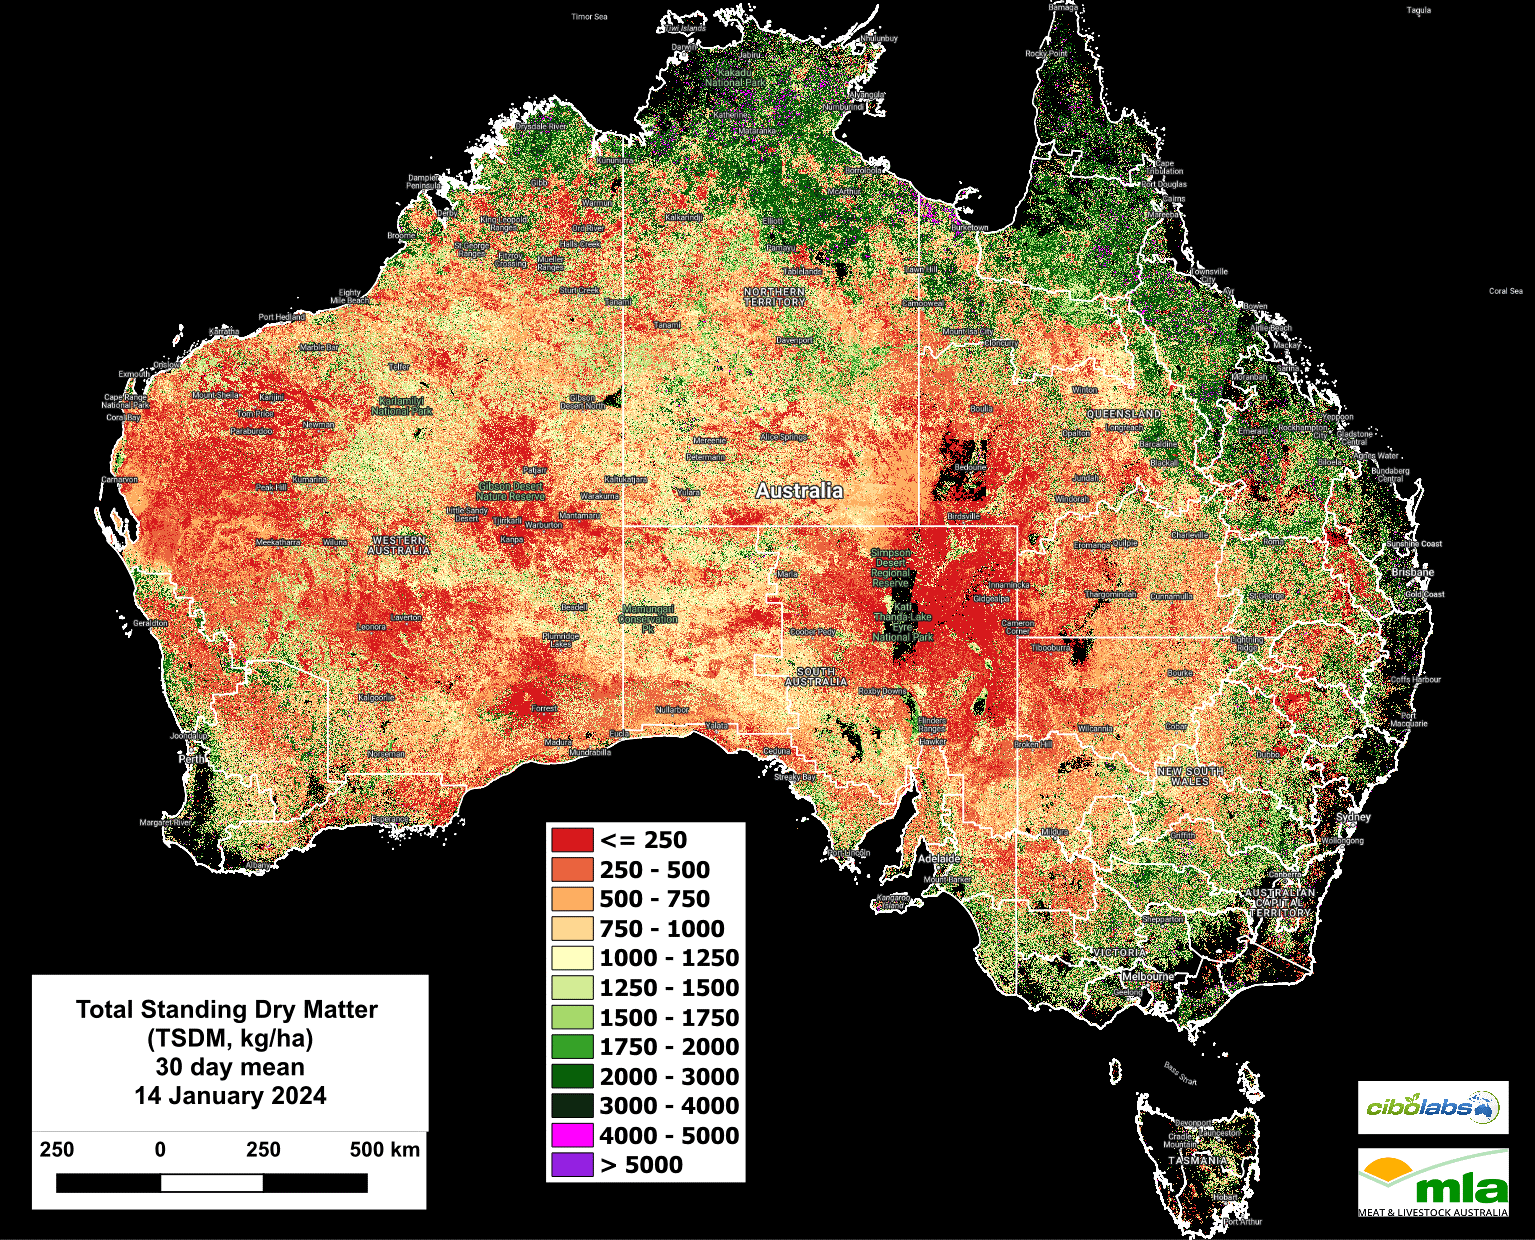
Image 1 – Total Standing Dry Matter (Kg/Ha)
As expected, Total Standing Dry Matter (Kg/DM/Ha) have increased in amounts for north Queensland and into the southern Gulf regions, reflecting the positive wet season rainfall. Areas of high TSDM amounts extend south to the northern Darling Downs, where levels start to noticeably decline. The Condamine NRM region and southern portion of the Burnett Mary NRM region of Qld have seen significant declines in TSDM amounts which is at odds with the rest of the state.
Eastern & Southern NSW, as well as most parts of Victoria remain well within TSDM amounts of 1500 – 2000 Kg/DM/Ha. The western division of NSW and the Mallee region of Victoria have seen TSDM levels fall below 900kg/DM/Ha on average in recent weeks. While much of South Australian TSDM levels also remain below 1000kg/DM/Ha there are some areas around the Flinders ranges, north to Roxby Downs and across the unincorporated areas which have good levels of herbage mass, reflecting recent rainfall events.
Imagery and analysis provided by CiboLabs
Western Australia also reflects some new growth areas following recent rain bands in the southwest as well as through the Pilbara and Gascoyne. The northern Kimberly region and across into the top end of the Northern Territory have TSDM totals reflective of the current wet season.
Seasonal Comparison Total Standing Dry Matter
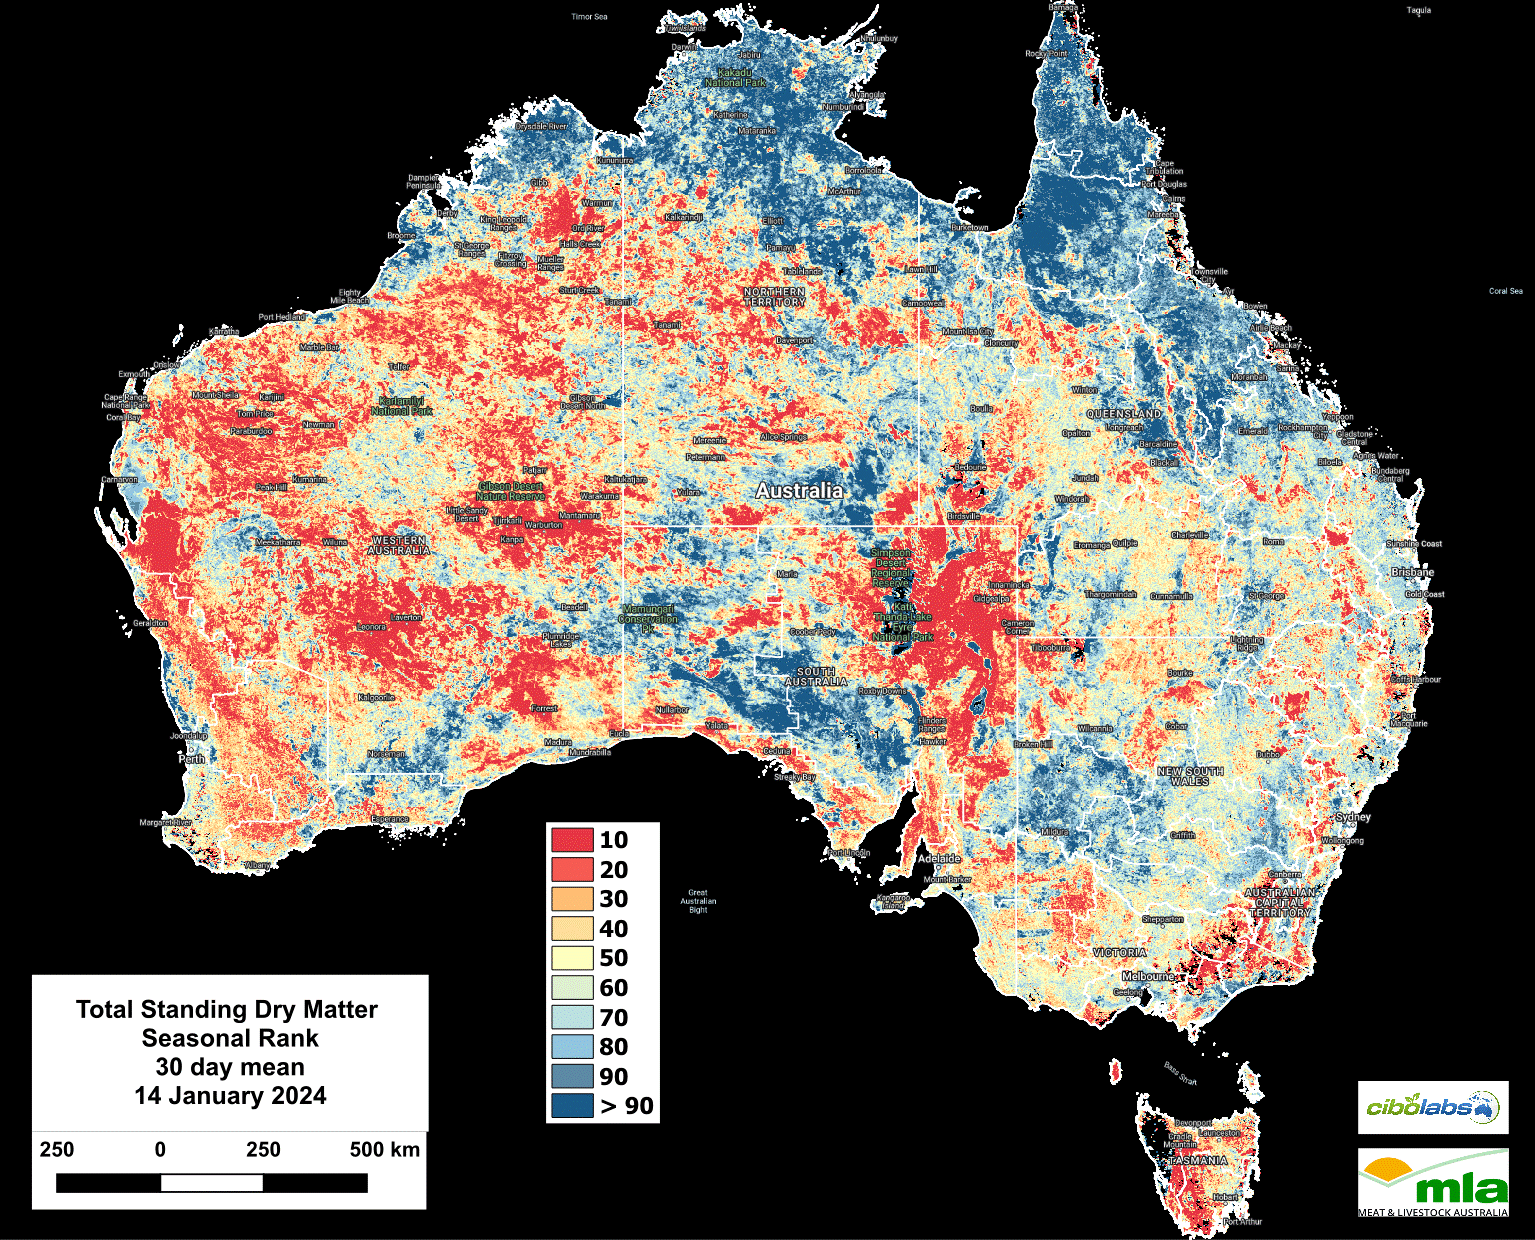
Image 2 – Seasonal Comparison Total Standing Dry Matter
The current Seasonal Ranking has seen a continued improvement for much of Northern Queensland, which is now recorded as in the Top 90 decile range, indicating seasonal conditions very much above the average.
The areas of Qld and NSW that are considered average or below average have contracted to the western regions, such as southwest Qld and the northwest of NSW.
South Australia has also seen a slight expansion in areas enjoying a season above the long-term average for this time of the year, following off the back of accumulated and recent growth (Figure 2).
Fractional Cover (Growth)
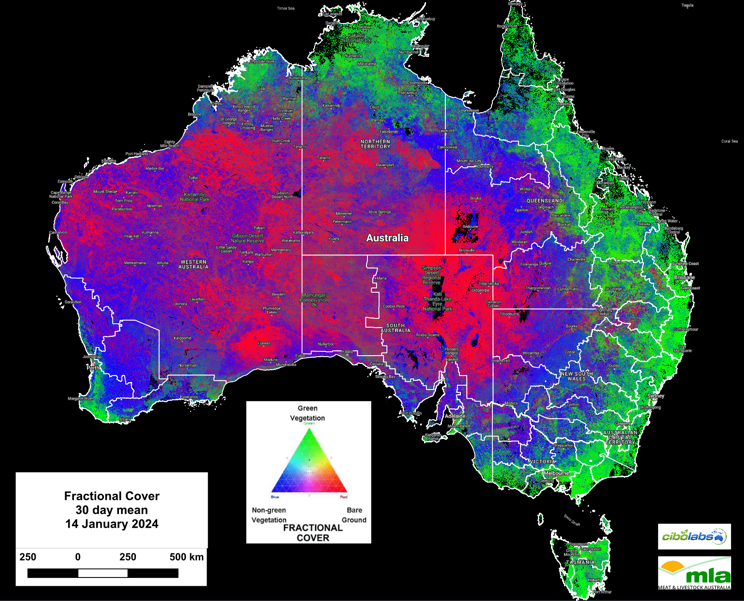
Image 3 – Fractional Cover
Fractional Cover (Image 3) continues to highlight the areas of herbage growth on the back of rainfall events.
The rainfall patterns including storm events in recent weeks, along with the accumulated soil moisture from pre-Christmas events is reflected in most states.
Green Total Standing Dry Matter
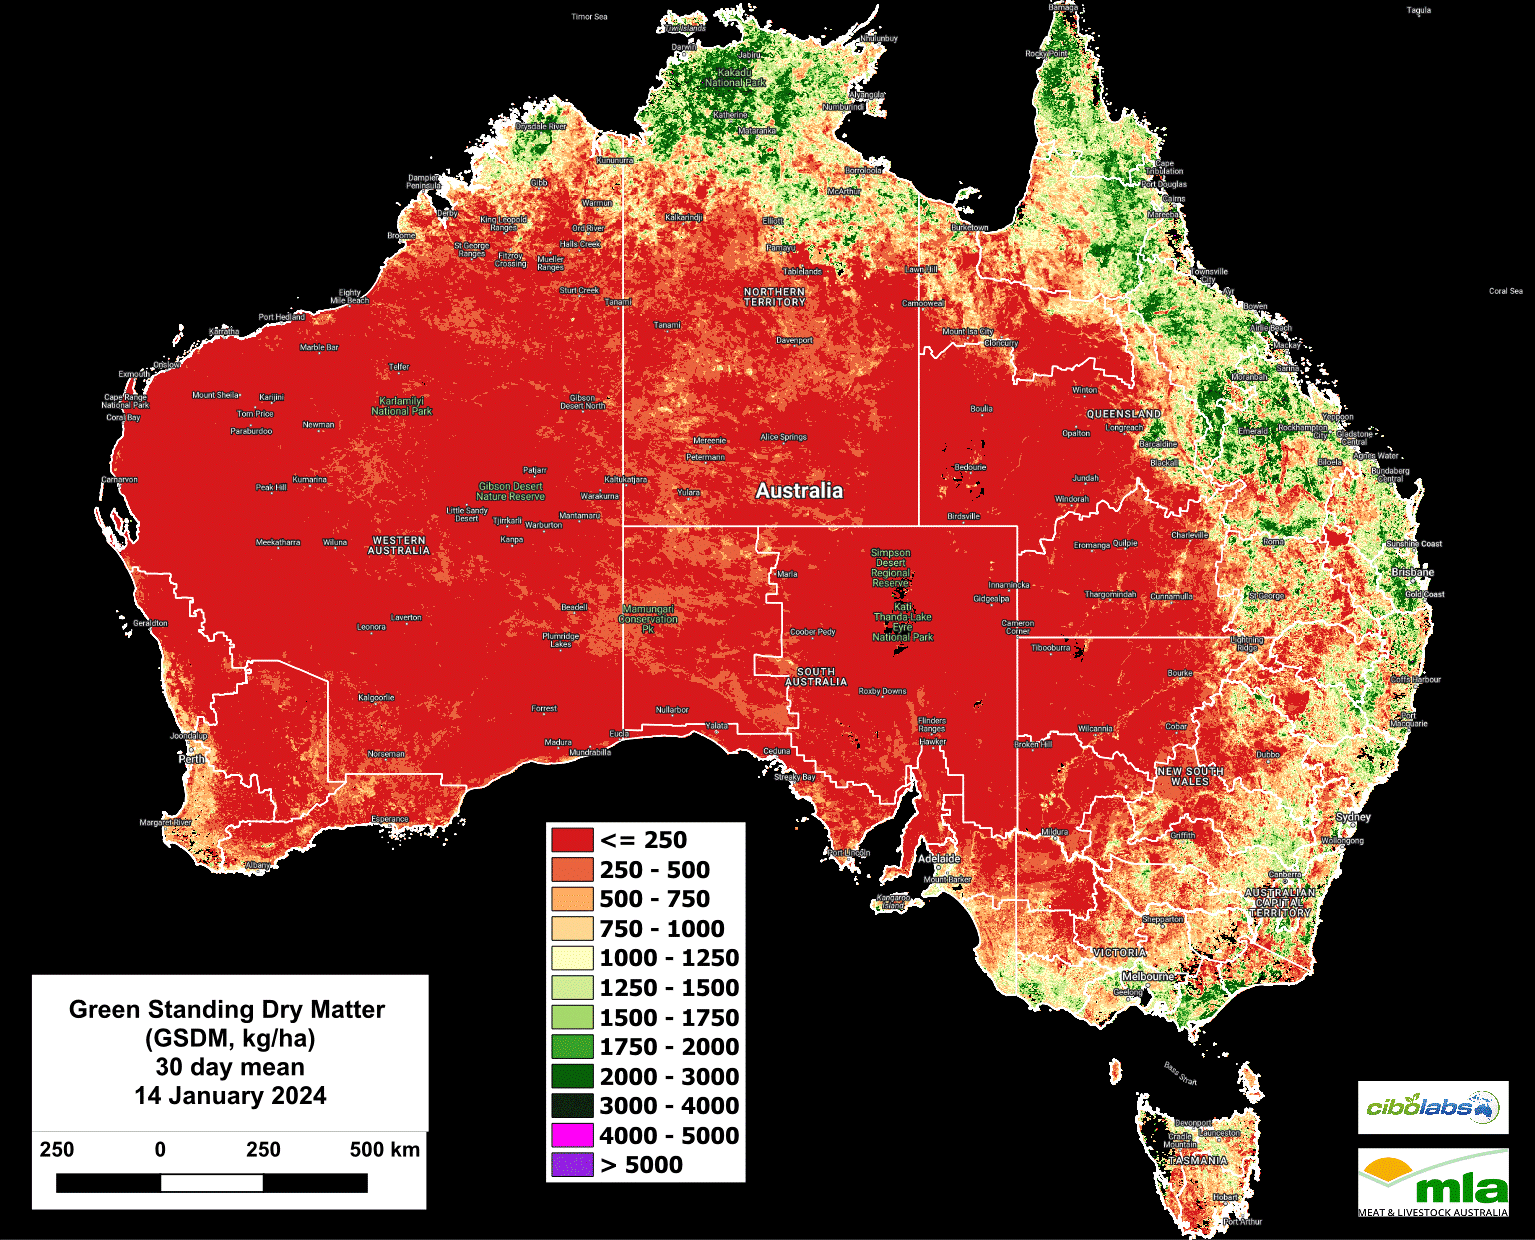
Image 4 – Green Standing Dry Matter
The contribution of Green Standing biomass to total feed availability remains most noticeable in coastal NSW, particularly in the north coast and lower Hunter regions.
The high green dry matter levels continue north along the Qld coast and hinterland, however much of the green growth remains restricted to the eastern seaboard of that state.
Further north the Top End and northern Kimberley in WA also have significant levels of Green Standing Dry Matter. (Image 4).
Dead Standing Dry Matter
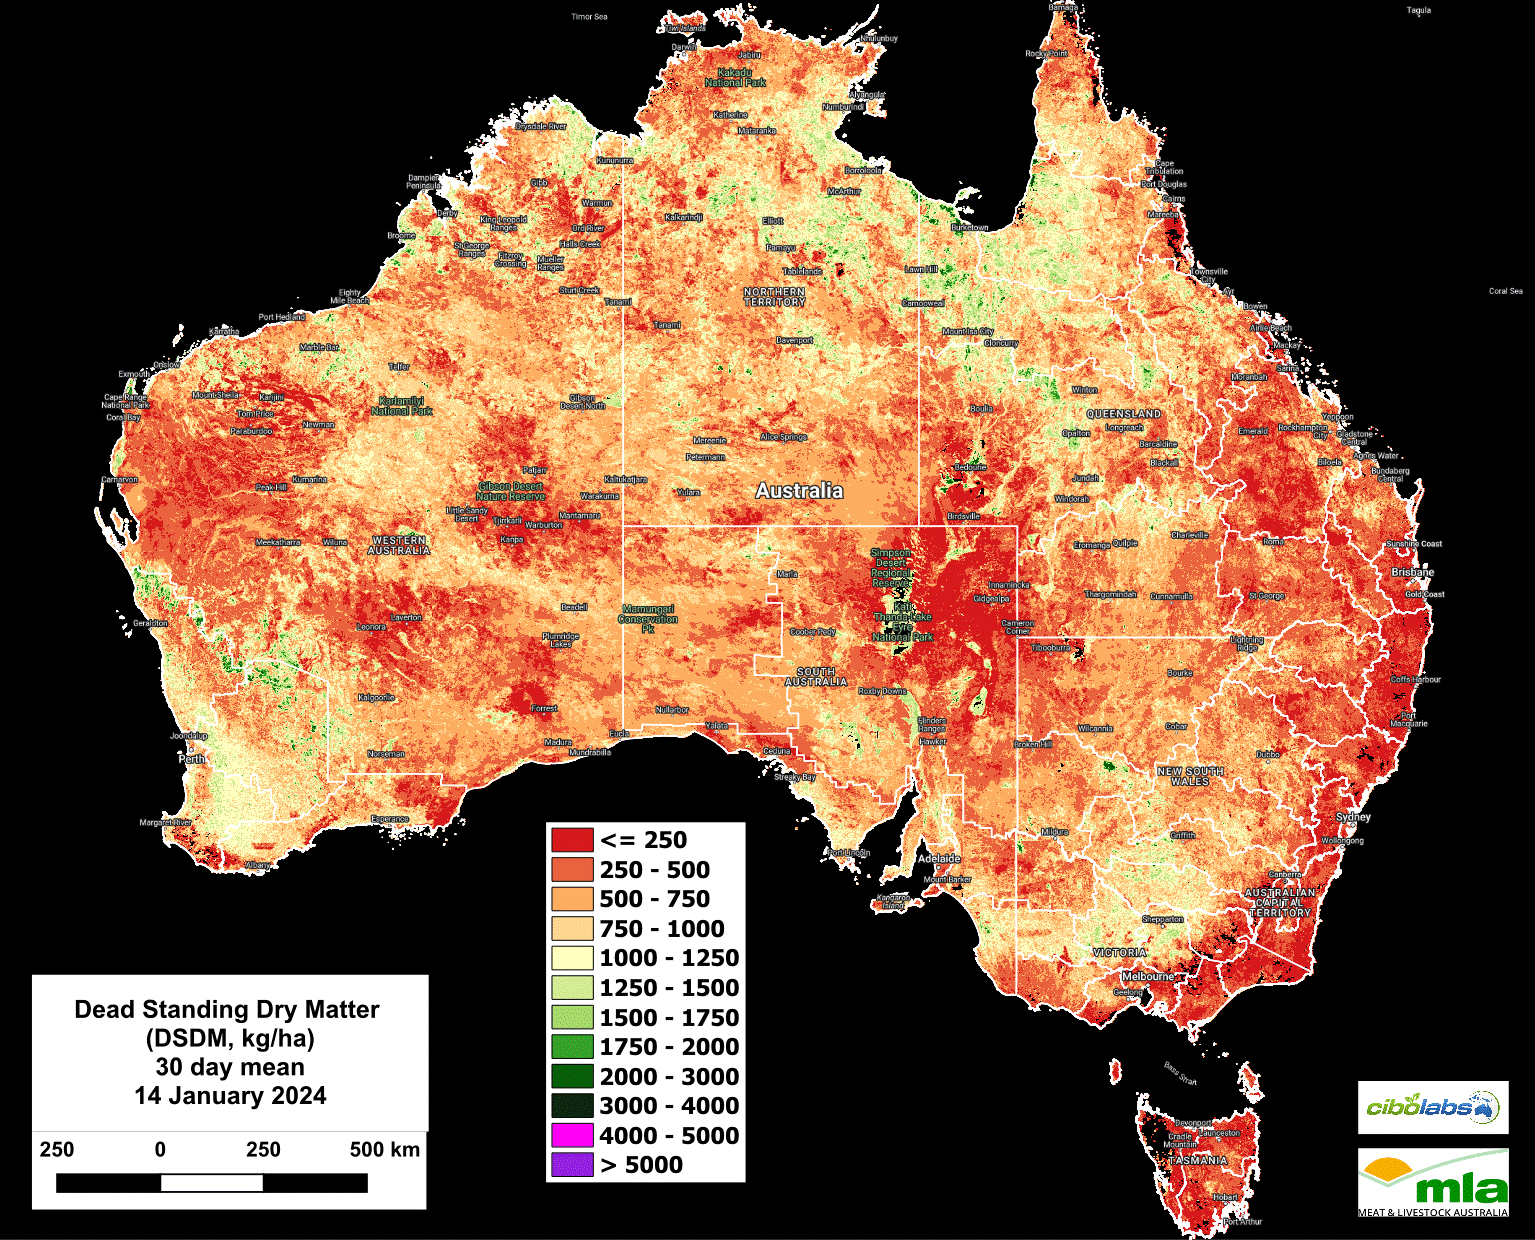
Image 5 – Dead Standing Dry Matter
Dead Standing Dry Matter amounts are now exhibiting a degree of variation across the states (Image 5).
While much of Queensland has lower levels of Dead Standing Dry Matter, the southern Gulf, leading south towards the channel country shows high levels of dead material (>1500kg DM/Ha) a result of earlier growth and a good end to 2023.
Similarly, the areas around the Flinders Ranges and further north in South Australia also have total amounts in the range of 1200 – 1800kg DM/Ha.
In southwest Western Australia there remains a distinct band of Dead Standing Material above 1500kg DM/Ha running from north of Geraldton in a south easterly direction towards Merredin and Kalgoorlie.
Monthly Ground Cover levels
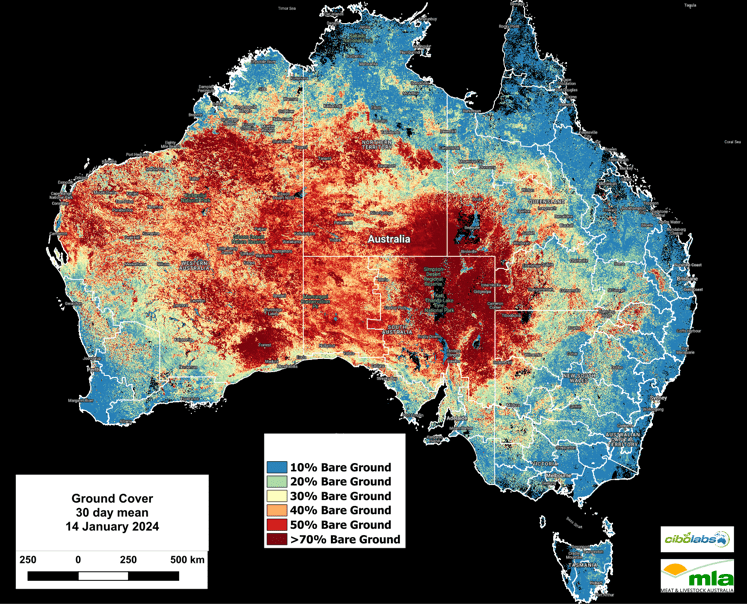
Image 6 – Ground Cover
National Ground Cover levels (30-day rolling average – Image 6) remain largely unchanged in eastern Australia.
In Western Australia, there has been a continuation of slight improvement in areas of ground cover and this slight improvement extends into the north-western corner of South Australia with some slight gains noticeable.
For more localised information including regional level overviews, users are encouraged to explore the Cibo Labs Regional Comparison. This tool provides regional data that may show the impact of localised weather or fire events. A further level of detail for individual properties is available for users who have created an Australian Feedbase Monitor account, which can be accessed both through the MyMLA portal or through the Cibo Labs website.
The Cibo Labs National Comparison can be used to freely access these layers (https://www.cibolabs.com.au/products/national-comparsion/) to view the most recent images from a national, state or catchment level.
This tool can complement the Australian Feedbase Monitor which can also be created within the Cibo Labs Web Site www.cibolabs.com.au


HAVE YOUR SAY