
Townsville based property valuer Michael Chaplain, from Taylor Byrne, takes a look at grazing property sales activity in six local government areas in his area this year, and finds a common denominator: grass.
THE 2018 year that has unfolded thus far for north Queensland region property has been driven by one somewhat obvious but very important factor: grass.
We have witnessed a string of relatively strong sales throughout North Queensland with nearly all these sales showing an uplift in values, but also having two distinct factors in common.
Firstly, they all had grass after receiving good rainfall from the low pressure system that came through in February/March. Secondly, they were all purchased by buyers who were in need of that grass. Examples of these sales include:
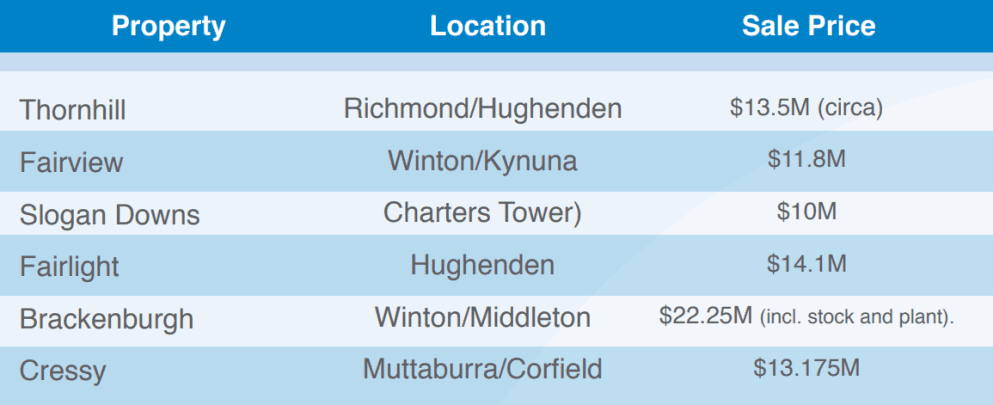
To put the above sales into context, in the two and half years prior to January 2018, there had been a total of six sales in the region which exceeded the $10 million threshold. This year we saw the above mentioned six transactions take place within a three-month period from May through to July.
The majority of these were all genuine grass sales, however we note two of the sales were purchased by the same buyer who was not in need of grass (although the sales were certainly influenced by the high degree of demand from grass buyers at the time).
It is also worth noting that almost all of these sales involved non-local buyers with a heavy influence from Central Queensland.
Market Analysis
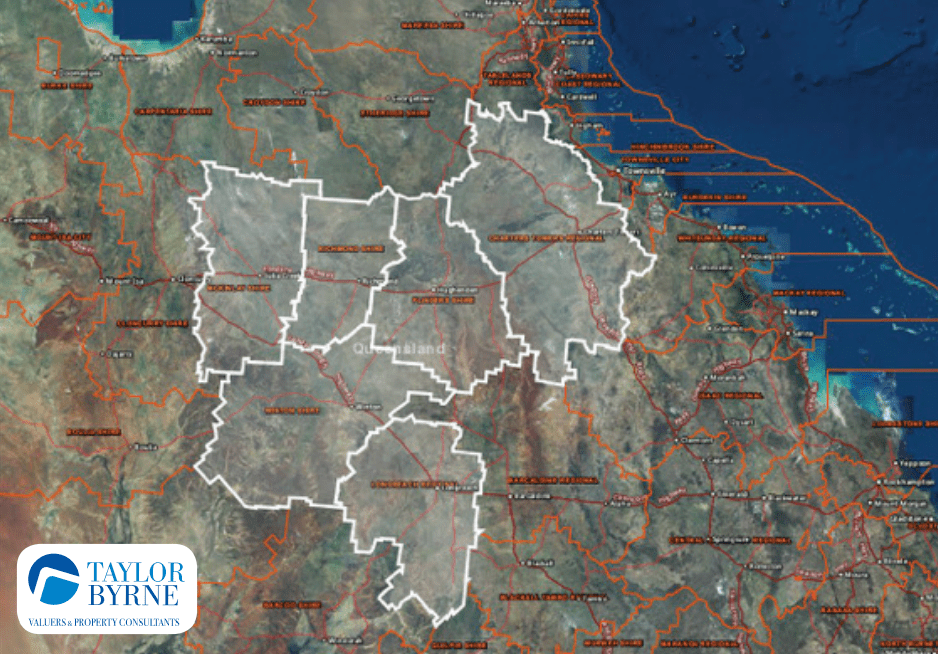
Comparing the 2015 financial year with the 2017-18 FY for properties greater than 1000ha in size, our most recent market analysis has shown strong year-on-year gains across most northern Queensland Local Government Areas (LGAs). We have analysed a sample of the more frequently-traded local government areas across North Queensland, including Charters Towers, Hughenden, Richmond, McKinlay, Winton, and Longreach, as indicated on the map below.
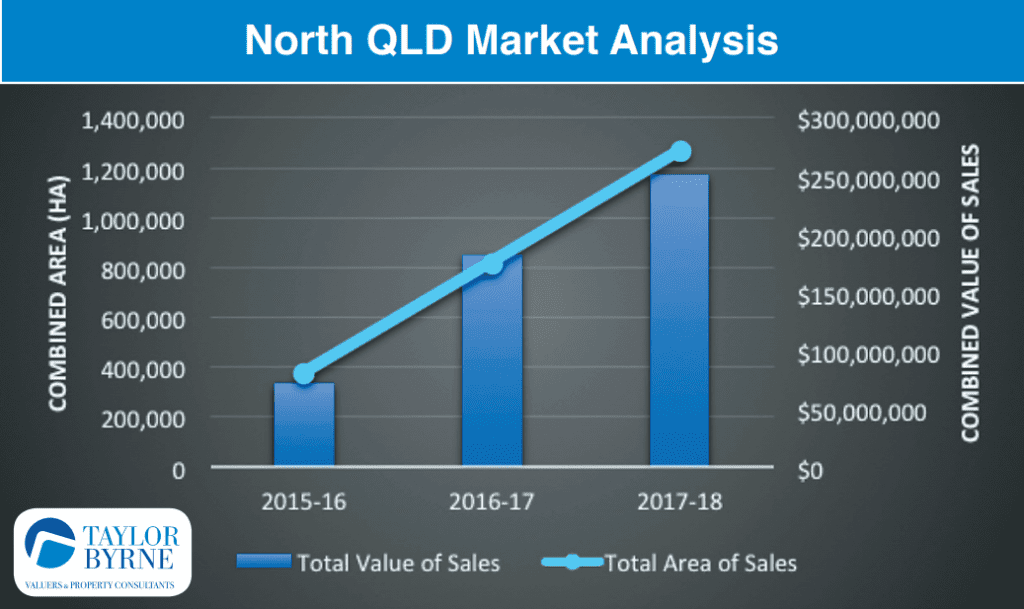
The graph below indicates a 71 percent increase in the total combined value of sales from the 2015 to 2017 financial years. This increase is closely mirrored by the 70pc increase in the total combined area of the sales.
The mapping below provides the best explanation for this dramatic increase in turnover of properties through this period, comparing rainfall July/June 2017/18 to July/June 2014/15.
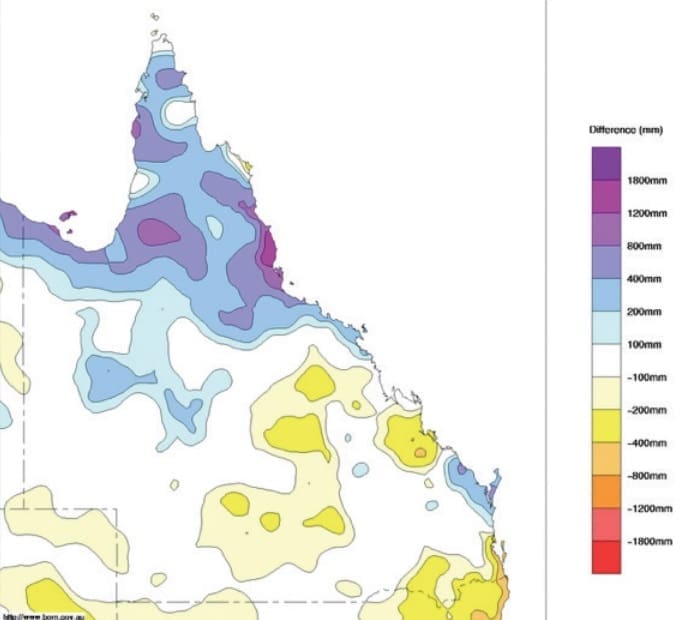
This map shows the difference in rainfall recorded from the 2017/18 financial year relative to the 2014/15 financial year, and in our view has a direct correlation with the property market trend through this period.
We have taken a closer look into what has been driving these recent market trends and identifies some ‘market hotspots’ where there appears to have been above average activity.
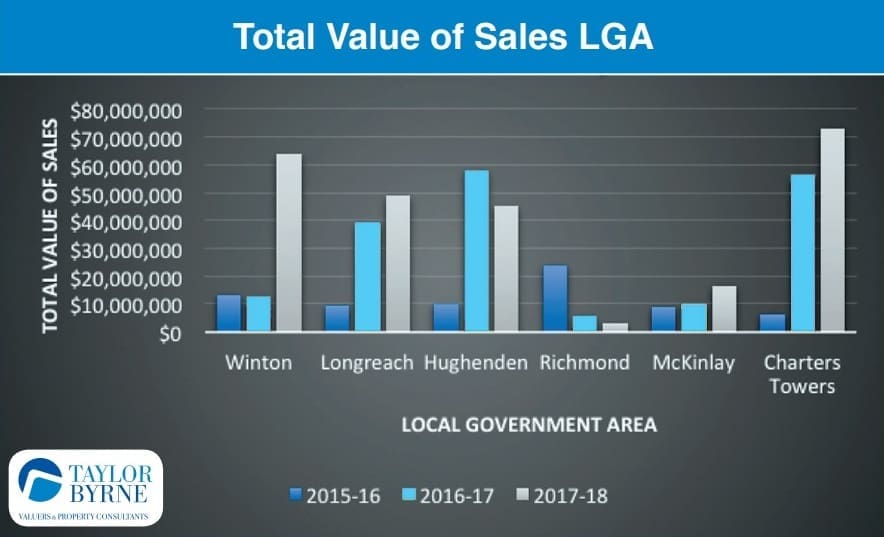
Total Value of Sales by LGA
The first data-set we analysed was the Total Value of Sales across each of the Local Government Areas. This data showed that four out of the six LGA’s had an increase in the total value of sales in the past financial year. The Winton Shire was the standout performer with an 80pc increase in the total value of sales. The Charters Towers LGA showed a less dramatic but none the less strong increase of 23pc over the previous 2016 financial year results. A notable mention also goes to the traditionally tightly-held McKinlay LGA with a 39pc increase, although this is over a far lower threshold.
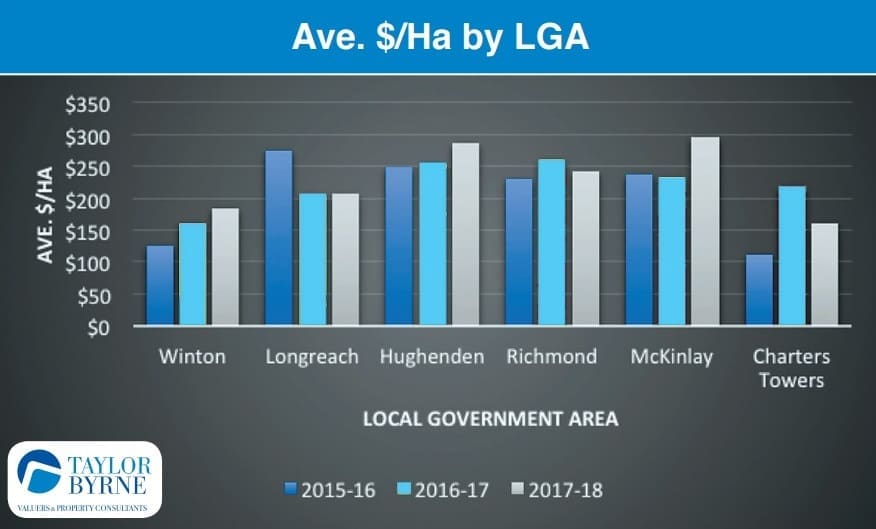
Average Dollar Per Hectare Rate by LGA
The next data set we analysed was the Average Dollar Per Hectare Rate ($/ Ha) across each Local Government Area.
At fist glance four out of the six LGAs increased on a $/Ha basis over the past 12 months. The Hughenden, Winton and McKinlay Shires indicated an increase in $/Ha values of 11pc, 13pc and 21pc respectively, which appears generally in line with what we would have expected.
However we note that the Winton LGA lifts to a 28pc increase when the Brackenburgh sale is omitted (due to its larger area of relatively low-value country) which is more indicative of the general value increases we have been observing.
Likewise, the Charters Towers figures (which show a decrease in value) are somewhat skewed by the Longton and Natal Downs sales which included a relatively large area of low value country which decreased the 2017 year figures.
When these sales are omitted, the balance of the market evidence shows a 38pc increase in the $/Ha rate. We believe a more normalised percentage increase would be in the order of 15pc to 20pc.
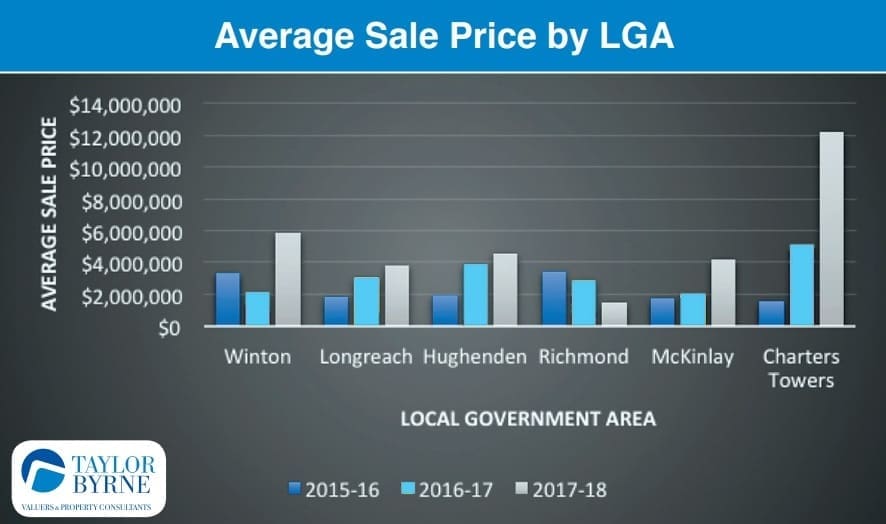
Average Sale Price by LGA
Finally we looked at the average sale price across all the LGAs, which provides some of the most compelling market data with five out of the six LGAs recording an increase. Even more interesting is the enormous lift in the percentage increases, with three of the LGAs (Winton, McKinlay and Charters Towers) showing an increase in excess of 50pc, while Hughenden and Longreach recorded more modest increase of 15pc and 20pc respectively.
Richmond was the only LGA to record a lower average sale price, although we note that this is likely due to lack in the depth of the market data with only two sales recorded last financial year, caused by what we believe was a lack of supply rather than lack of demand.
The Simple Law of Cause and Affect
There are two telling factors which explain the above: firstly, who is buying the land? And secondly, why are they buying it? We believe the map below, illustrating February-April rainfall 2018, helps illustrate this point:
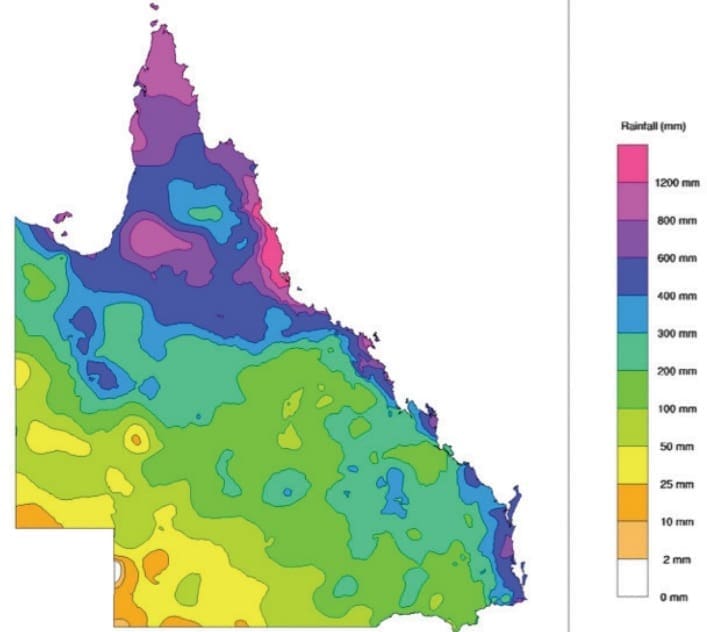
There has been an intense level of market activity within the area marked with the red circle. This takes in the majority of the Winton LGA which has seen the most consistent increases across all data sets detailed above.
The yellow circle indicates the Charters Towers LGA that has also seen significant increases in market activity over the past 12 months. We believe it is no coincidence that both these areas also received some of the better rainfall recordings in the earlier part of this year.
This has led to a string of ‘grass sales’ with a number of non-local buyers active in these areas. As shown in the data provided above, this has had a dramatic impact on values in these areas.
However it remains to be seen if these values can be sustained if there is a return to more ‘normal’ seasonal conditions this summer.
Thanks for that Bob, you are correct, the red and yellow circles should have been on the map although they appear to have been lost somewhere along the line. Thanks for giving us the heads up.
Thanks for doing the data analysis in this article Michael – well done. I couldn’t find the red and yellow circles – I assume they were supposed to be on the map of Qld.
Cheers,
Bob