CONNECTING the dots between eating quality performance, meat yield and animal health outcomes is the latest frontier for Meat & Livestock Australia’s program focus on carcase performance feedback, and how it can be better utilised by producers.
Speaking during MLA’s Impact through Supply Chain Innovations webinar on Monday, MLA’s group manager for adoption and commercialisation, Sarah Strachan, said along with eating quality, there were a couple of other parts of the ‘feedback puzzle’ that that define the whole value of each animal that enters the food chain.
MLA group manager for adoption and commercialisation,Sarah Strachan
“There’s a great opportunity to be on the benefits being derived from genetic improvement by connecting more of the dots we can gather through the various types of feedback on animal performance from processors and brand owners.
“The puzzle seems to be made up of just a few things that explain the majority of the variation we would see in animals, and the value of those animals,” Ms Strachan said.
In simple terms, this could be categorised as, how much meat there is to sell (lean meat yield); how well that meat eats (Meat Standards Australia eating quality, measured using the MSA index); and what impact animal disease has on both of these.
Over the past six months MLA had started working with supply chains to identify what those value levers are, and which are most important, in proportional terms, depending on each supply chain and the markets they are servicing.
“We’re also looking at how we can generate this information and turn it back into connected feedback to processors and producers as well,” she said.
30 million carcase yield records
As part of the program, lean meat yield data had been generated over the past six months for every single MSA-graded carcase processed in Australia over the last decade, Ms Strachan said.
“That means more than 30 million carcase records now have have eating quality information matched up with yield information as well.”
Results had been “pretty enlightening,” she said.
Click on image for a larger view
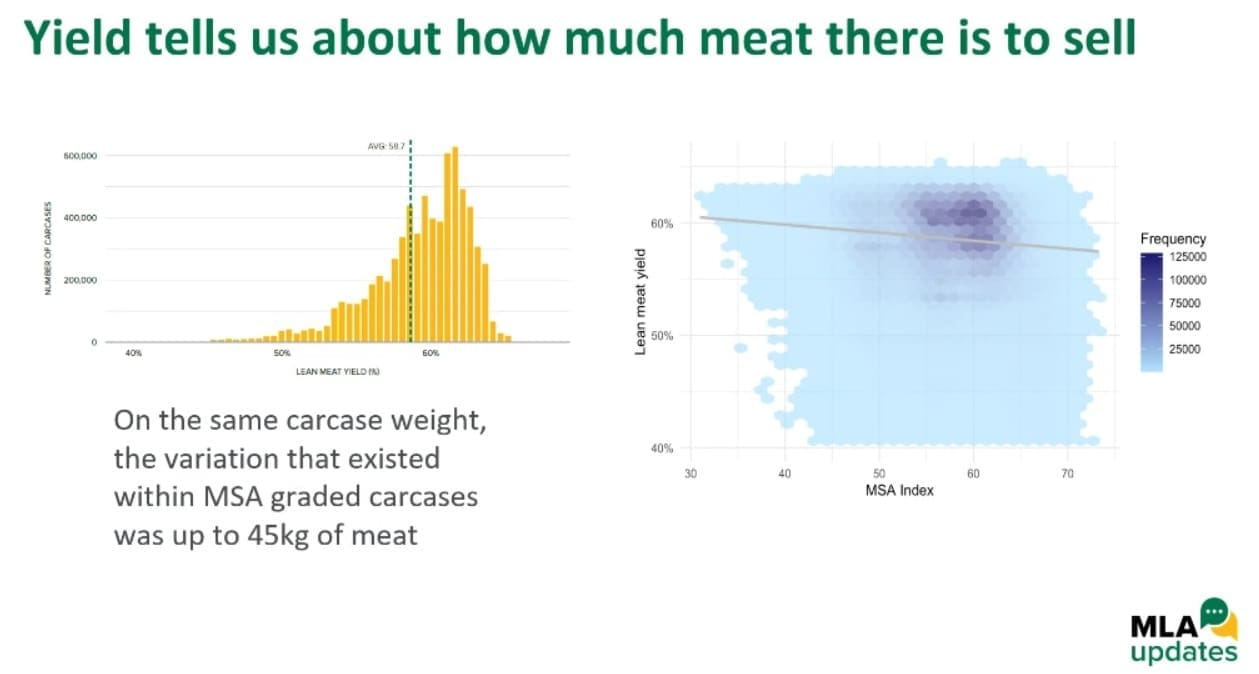
The yellow bar graph published here shows the variation in lean meat yield in MSA graded carcases for the last two years, with an approximate 15pc variation in lean meat yield between best and worst.
“What that means is that for two animals with exactly the same carcase weight (MSA average at present is 300kg), those two animals could actually have a difference of 45kg of boneless meat available to sell,” Ms Strachan said.
“Even if that meat was only sold as trim (grinding beef), it could represent a difference of $400 between those two (best and worst) animals. Yet at the moment, they probably receive the same dollars per kilogram, on an over-the-hooks trading grid.”
The blue ‘heat map’ on the right in the graphic above (plotting MSA index on one axis and yield on the other) shows that for the same MSA graded carcases, the majority (purple squares represent density) sit at around 58pc lean meat yield. But as the illustration shows, there is huge variation in yield, as well.
The descending line through the middle of the graph conveys the message that when lean meat yield increases, eating quality decreases – and vice versa.
“There is a real compromise to be struck here, because eating quality and yield don’t always go nicely, hand in hand,” Ms Strachan said.
Animal health performance impact
Another area of ‘connecting the dots’ on carcase value examined this year are the linkages between animal disease conditions, and whether they have any effect on eating quality.
“We are only still scratching the surface here, but it is really quite evident that there is an impact, in the data we have already collected,” Ms Strachan said.
“But the good news is that we know so much about animal diseases and health treatments that we can actually do something about it.”
Data collected so far from a project, called Health for Wealth, covers animal disease feedback on slaughter cattle across Queensland and NSW. That data has been matched up with eating quality data through MSA feedback – the first time that has ever been done.
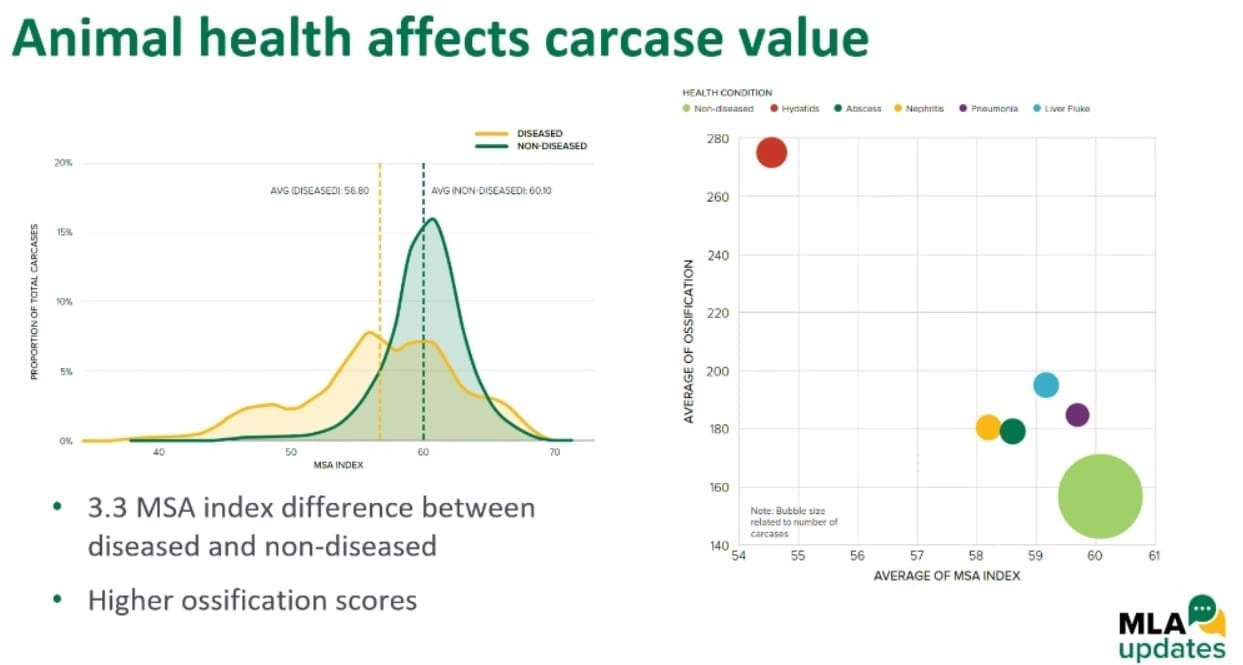
Results identified a more than three point difference in MSA index score, on average, between an ‘animal health compromised’ animal and non-compromised animals.
“What does three MSA index points actually mean?” Ms Strachan asked. “Results vary depending on the supply chain involved, but for some brand owners it could mean the meat from that animal makes it into the top premium brand – or it could miss out on an MSA premium altogether,” she said.
Ms Strachan said on current prices being paid, the difference for MSA compliant versus non-MSA cattle could be as much as $150 to $300 a head in value.
Click on image for a larger view
In the graph published here, the circles on the right side show the prevalence of different disease conditions, and how those impacted on eating quality – as well as ossification scores, which are linked to eating quality.
Cattle identified with hydatids, for example (red circle), appeared to have the biggest impact of all disease detected on eating quality performance – also driven by their higher ossification scores.
“This could indicate that the animal itself is more physiologically mature (it has a greater disease load), or has experienced hardship because of that disease load,” Ms Strachan said.
The data showed that in Queensland, alone, there was an 11pc incidence of hydatids in carcases assessed under the trial.
“That got me thinking, at an individual level, if this only affected the value of the livers, alone, that could amount to $9-$10 a head, because those diseased livers can no longer enter the food chain,” she said. “If that was the case for all Queensland cattle, last year that could have represented a value loss of $30 million.”
Click on this link to view an earlier Beef Central article on the impact of hydatids.
“All this has been quite revealing in terms of identifying what opportunity still lies ahead in terms of learning from linking yield and animal health information with MSA eating quality index information,” Ms Strachan said.
She said the project was starting to ‘connect the dots’ through the additional information that is now being collected along the supply chain or at the processing level.
“At the moment the eating quality data is easily accessed via the MyMSA platform, and MSA has just released the beef eating quality insights report for this year (link) offering new information on where each producer might be performing, against others. And for producers with access to Livestock Datalink, lean meat yield and animal health data can also be provided.”
“Over the next little while, producers will be able to see all this on one spot, in the feedback systems,” Ms Strachan said.
“It’s a clear message that we’ve jumped onto in the beef sector, and we have a way to do this as well for sheep.” The clear message from consumers is that they are willing to pay more for our product if we meet their expectations, because they are the only ones that actually put any money into our supply chain that we can all share.”