SINCE Beef Central’s weekly kill article “Possible grid price records, as processors strive to maintain breakneck slaughter pace” was published yesterday, more information has come to light about historic cattle pricing and whether current SEQ grids might have reached an all-time record.
In the early 2000s, Australia Meat Holdings (later to become JBS) Queensland grids reached 400c/kg briefly for 0-4 tooth grassfed steer +300kg and 395c/kg for six-tooth at the company’s Dinmore plant in southeast Queensland.
Grid offers were 10c/kg less than that at Rocky, and 10c less again at Townsville. EU steer back then was about 20c/kg above Jap ox, but it had a top weight of around 320kg in those days. There was no two-tooth premium for steer +300kg in that era.
For heavy cow, there is no question that this week’s grid offer from two large processors in SEQ of 370c/kg is an all-time record. That’s being driven squarely by international grinding beef demand.
MLA’s NLRS direct consignment historical data from the era also supports the information above, but is a little ambiguous, as it represents an average grid price among a selection of SEQ processors, rather than the best price evident in the market at the time.
So Beef Central’s claim yesterday of a possible record SEQ grid offer stands up strongly to scrutiny.
For students of history, we’ve done some research into what the drivers were that pushed prices so high in 2004.
Here’s what happened:
- BSE was discovered in the US in late 2003, leading to a five-year export bans in key importing countries like Japan and Korea, and placing enormous demand on imported meat supply out of Australia
- a strong US economy pushed the A$ value down from above US80c to below 70c
- the EYCI rose from around 300c/kg to close to 400c and
- there was a period of erratic rainfall in northern Australia, disrupting slaughter cattle flows, and forcing processors to bid up, in the face of high international demand.
All four of those factors, or variations of them, are again sounding pretty familiar.
…but how does this week’s pricing measure up, in real terms?
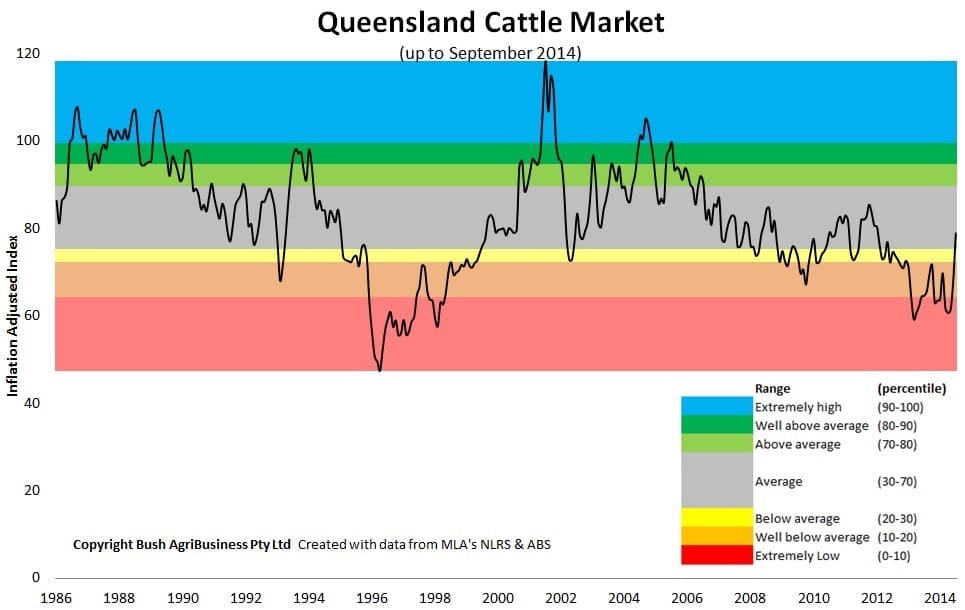
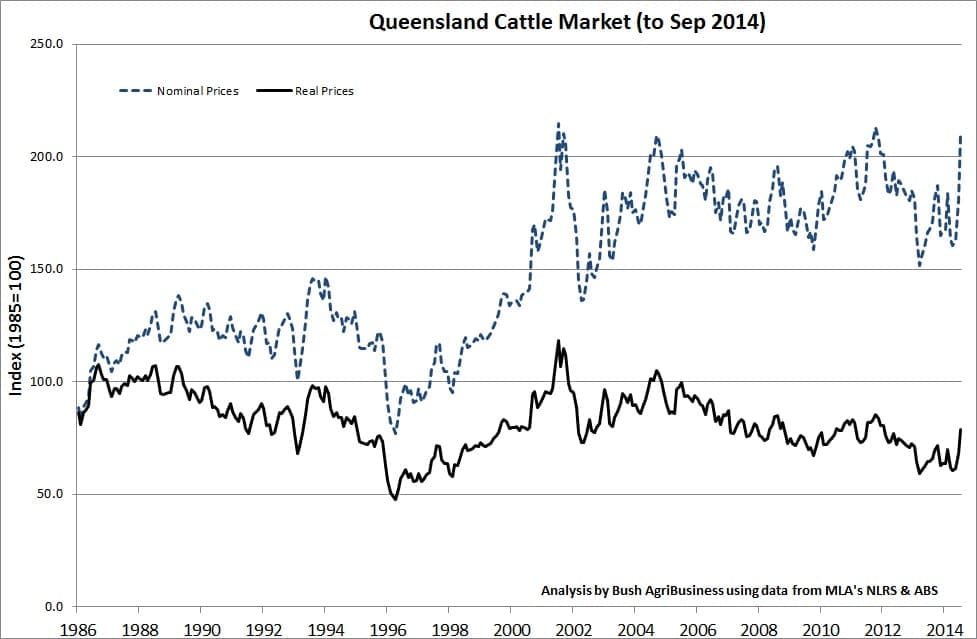
Published below are two valuable graphs produced by agribusiness consultants, Bush Agribusiness, which overlay the Queensland Cattle Market Index from 1986 to today, adjusted for inflation, and compare nominal and adjusted QCMI figures. Larger versions of the graphs can be viewed using the gallery tool at the bottom of this page.
It tells a very different story to the outright price trend. The price ‘spike’ seen in 2004 is in clear evidence in the graph, as is another three years earlier, in 2001.
But what it clearly shows is that, in real terms with inflation removed, prices are nowhere near record highs, in fact they rate little above overage. In fact the most recent QCMI figure of 218.4 from Monday is at the median of inflation-adjusted prices from 1986 onwards, Bush Agribusiness principal Ian McLean points out.
While beef prices are an important part of the equation, as this earlier Beef Central article clearly indicates, it is Cost of Production that is the key driver of producer profits, and producers can do more to influence cost of production than they can in prices received.
Click on images below for a larger view, or use gallery images at base of page.