Rainfall events over the past two weeks have been recorded over the eastern states, Northern Territory, eastern South Australia, and parts of Western Australia.
Some storm events have recorded totals in excess of 100mm with a number of locations exceeding these totals.
The Bureau of Metrology reports that November rainfall for the nation was 37.8% above the 1961-1990 average.
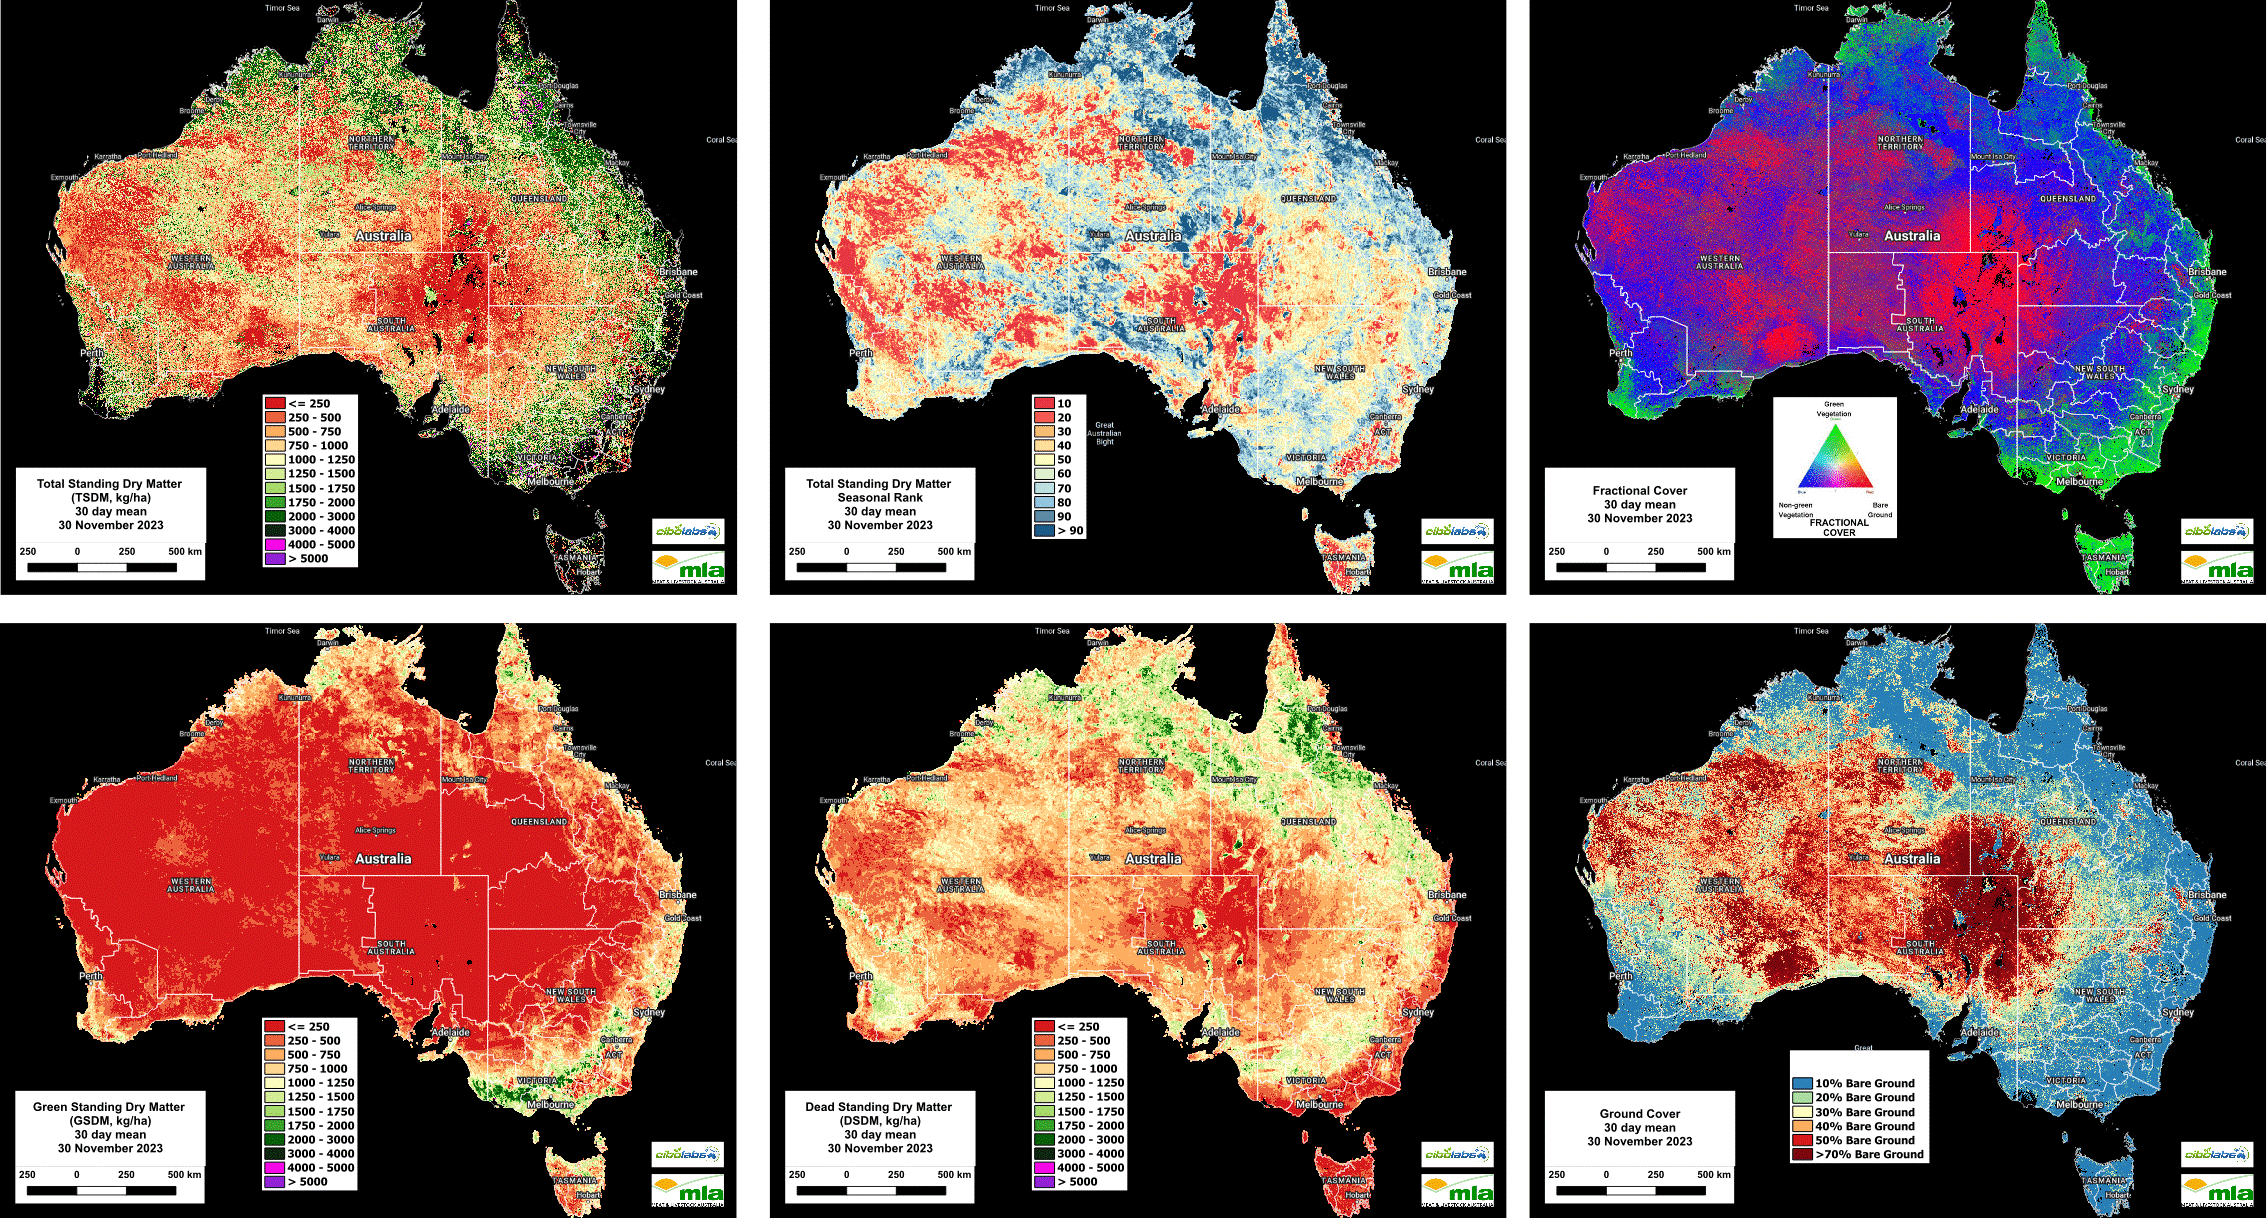
Total Standing Dry Matter
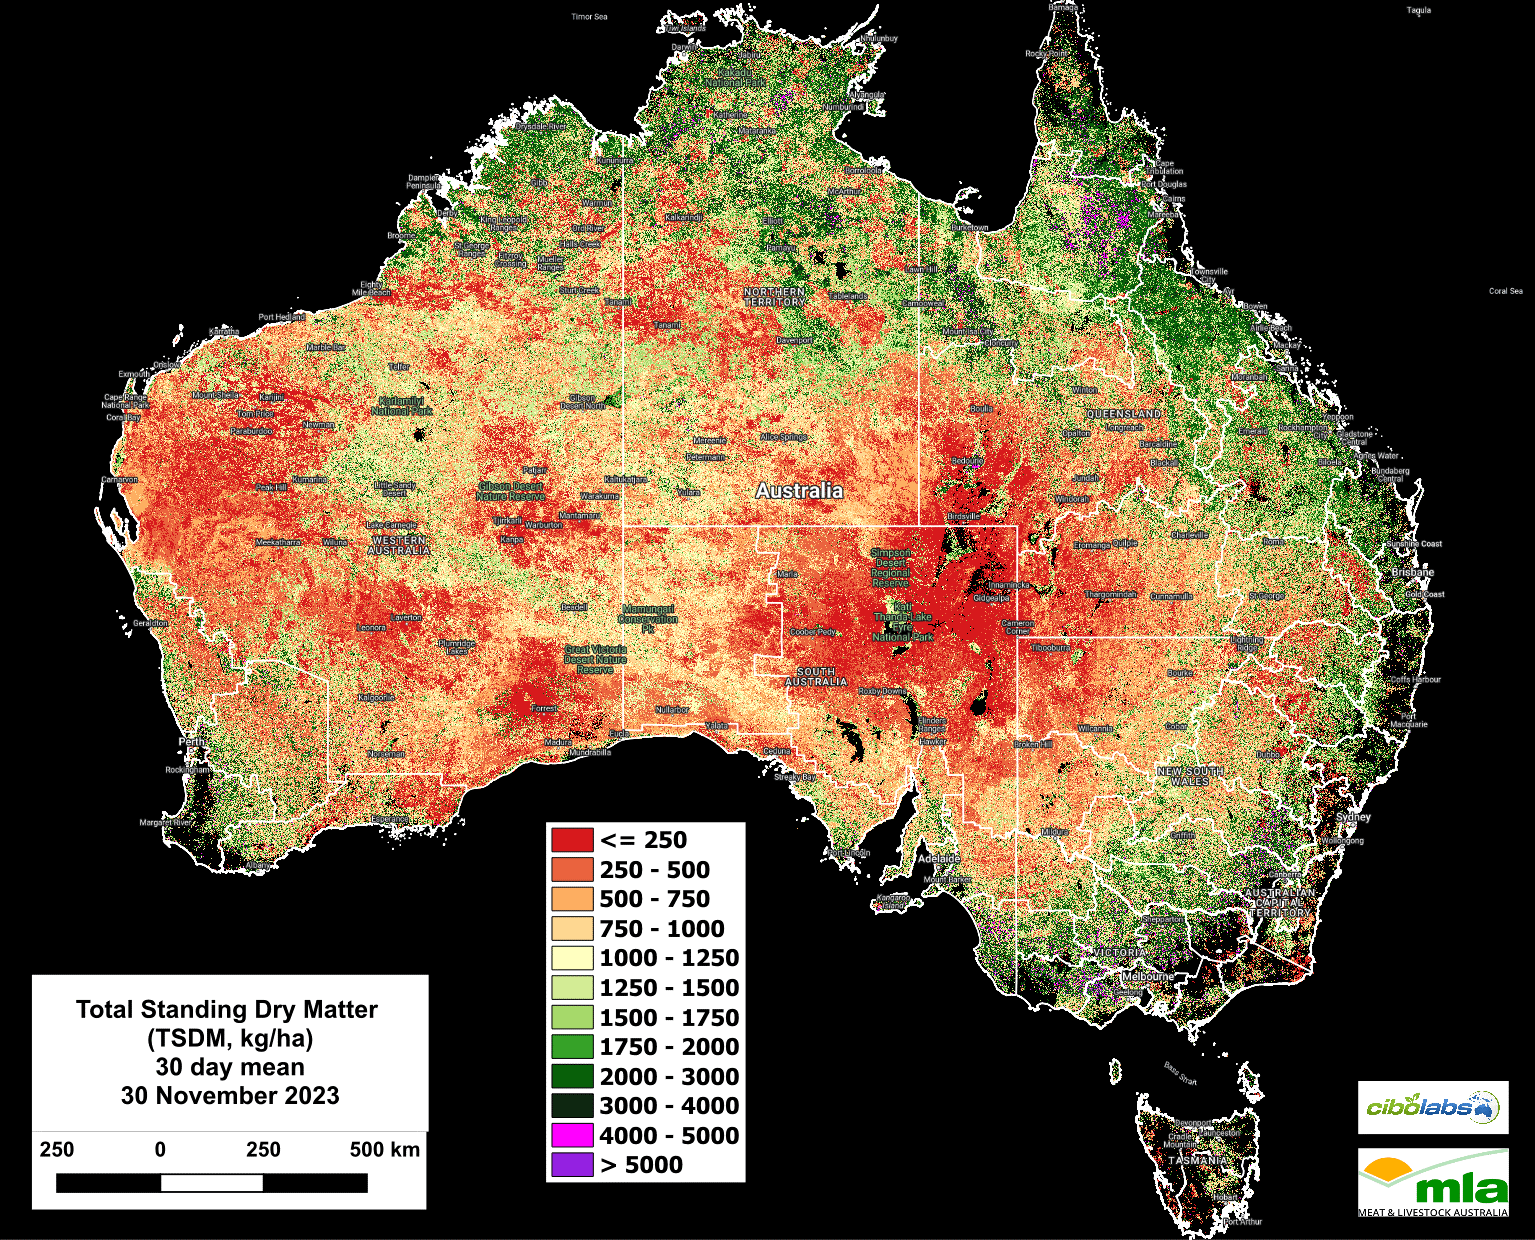
Image 1 – Total Standing Dry Matter (Kg/Ha)
While these events have prompted a response in pasture growth, there is still a time lag between rainfall events and useful pasture growth for graziers.
Imagery and analysis provided by CiboLabs
Nationally Total Standing Dry Matter continues to average below 900kg/DM/Ha, a decline of around 300kg/DM/Ha.
The national averages are impacted by the removal of biomass including harvested crops in southern NSW, Victoria, and South Australia.
Additional losses have been incurred through the North Queensland Dry Tropics, Tasmania and through the Kimberley region of Western Australia. (Figure 1).
Seasonal Comparison Total Standing Dry Matter
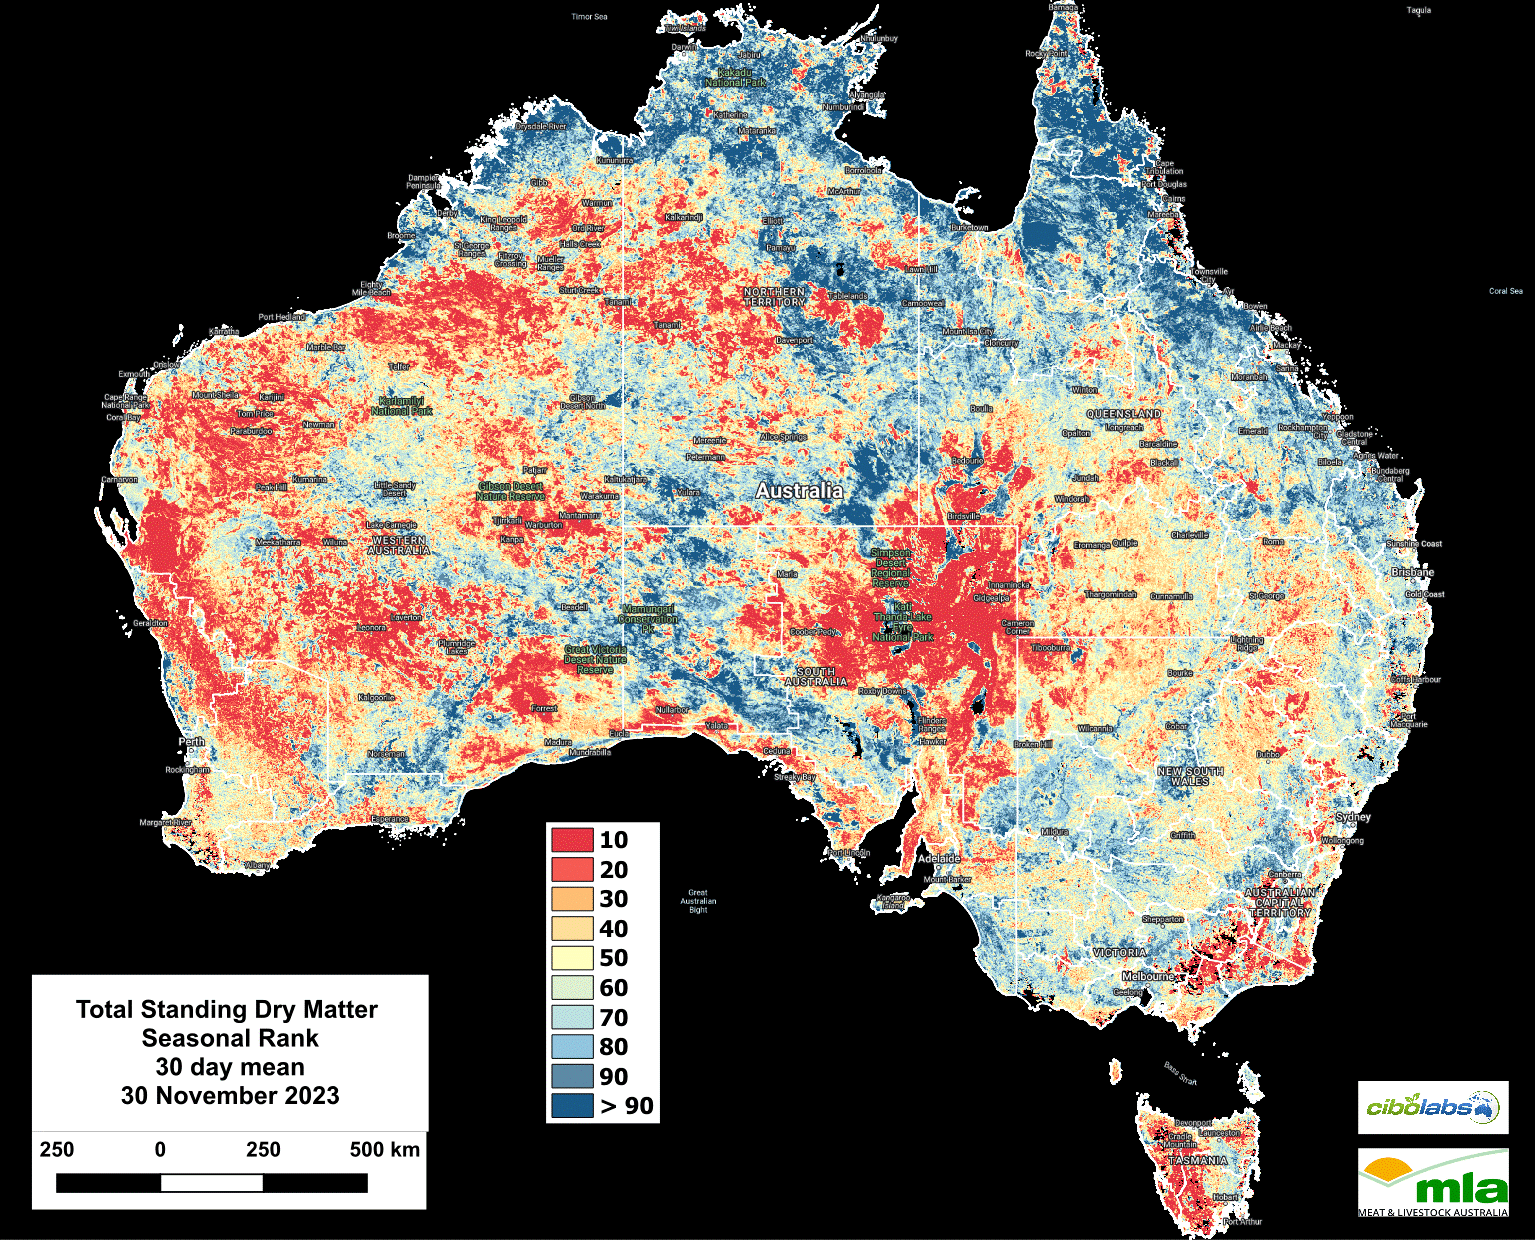
Image 2 – Seasonal Comparison Total Standing Dry Matter
The seasonal comparison of Total Standing Dry Matter is largely unchanged from the 15 November 2023 update.
An expansion of areas in the 30% decile and below has occurred in the Tanami region of the Northern Territory, and across the southwestern regions of Western Australia.
However, areas of the NSW Mid north coast and tablelands have shown some movement towards the long-term average (50% decile) reflecting earlier rainfall events. (Figure 2).
Fractional Cover (Growth)
Image 3 – Fractional Cover
The impact of rainfall has resulted in an increase in actively growing biomass (Image 3).
Noticeable growth events in NSW include an increase in green shading to the east and northeast of Dubbo, through the Upper Hunter and into the mid north and far north coast of NSW.
Tasmania continues to display high levels of growth, as does the areas southwest of Darwin in the Northern Territory.
Unfortunately, growth events in the southwest catchments and south coast of Western Australia have seen a decline in active growth in the past two weeks.
Green Total Standing Dry Matter
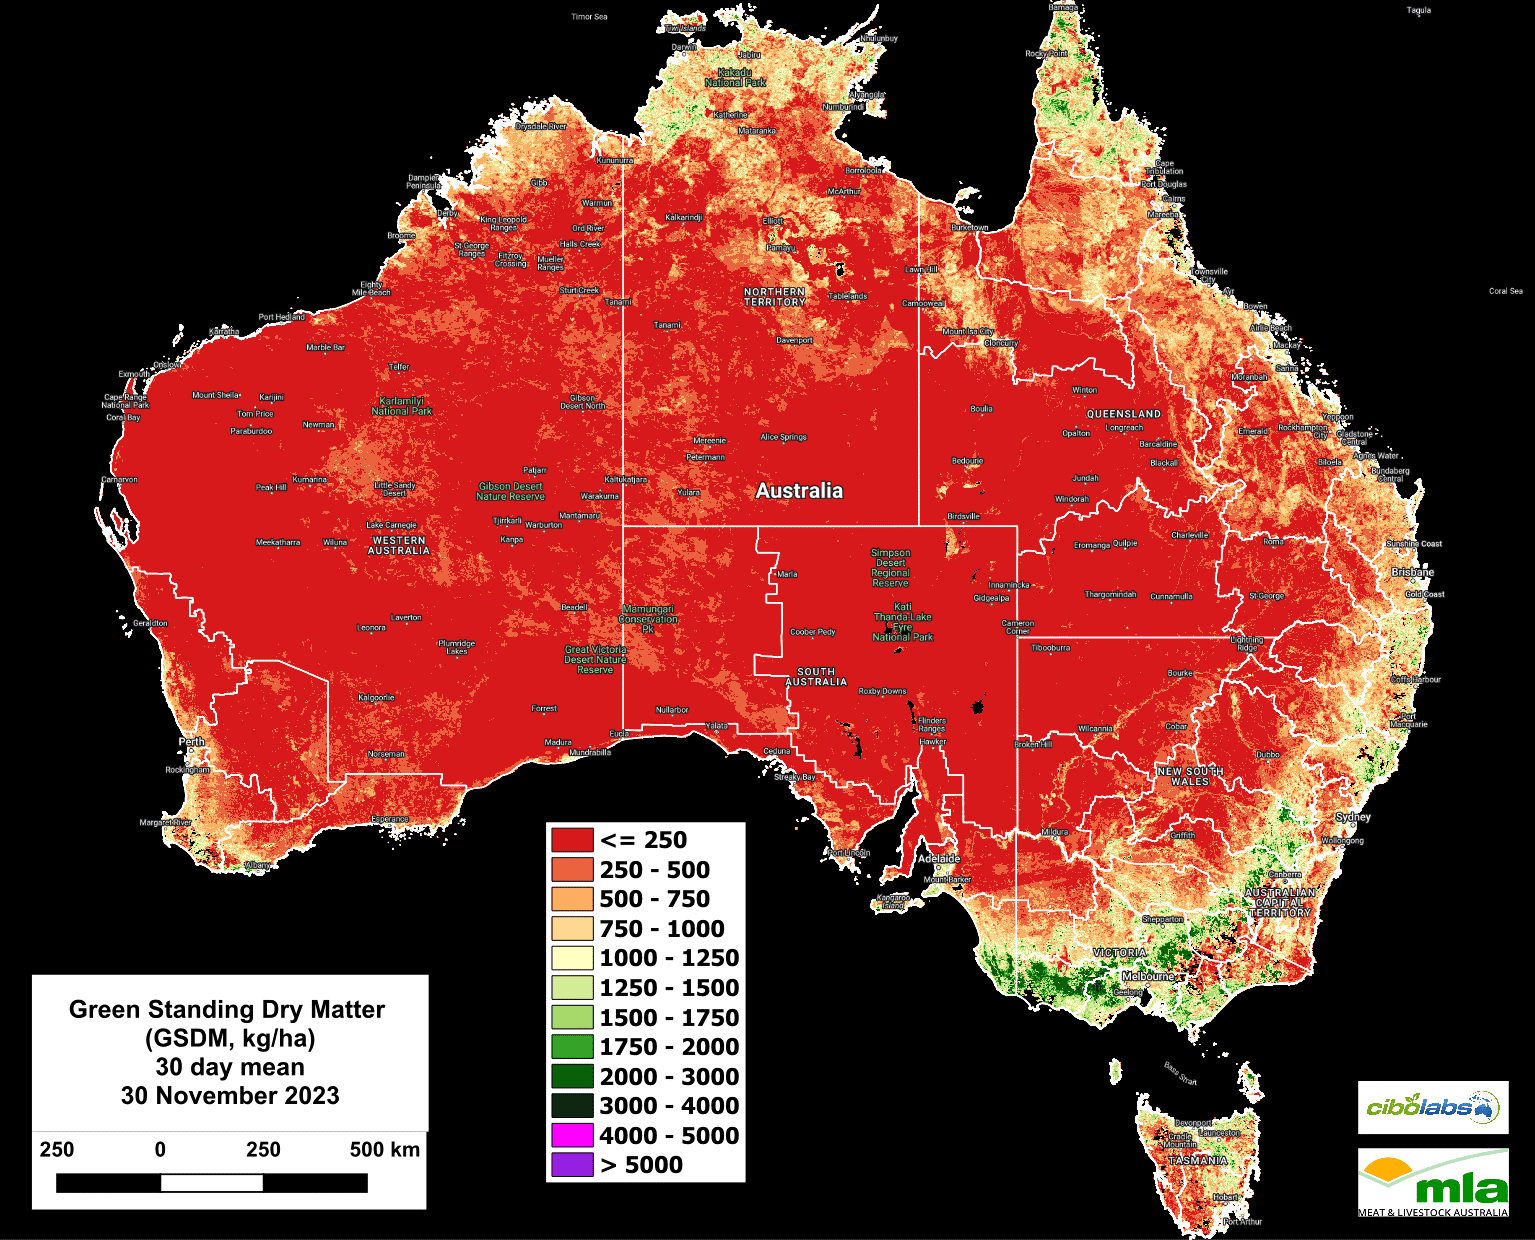
Image 4 – Green Standing Dry Matter
Although growth is occurring as a result of rainfall events, the availability of Green Standing Dry Matter levels remain very low in most regions with the exception of the lower Hunter Valley in NSW and the Gippsland region of Victoria where levels of Green Dry Standing Matter are now averaging above 1500kg/DM/Ha.
For the remainder of the continent the green proportion of the total available biomass remains below 500kg/DM/Ha (Image 4).
Dead Standing Dry Matter
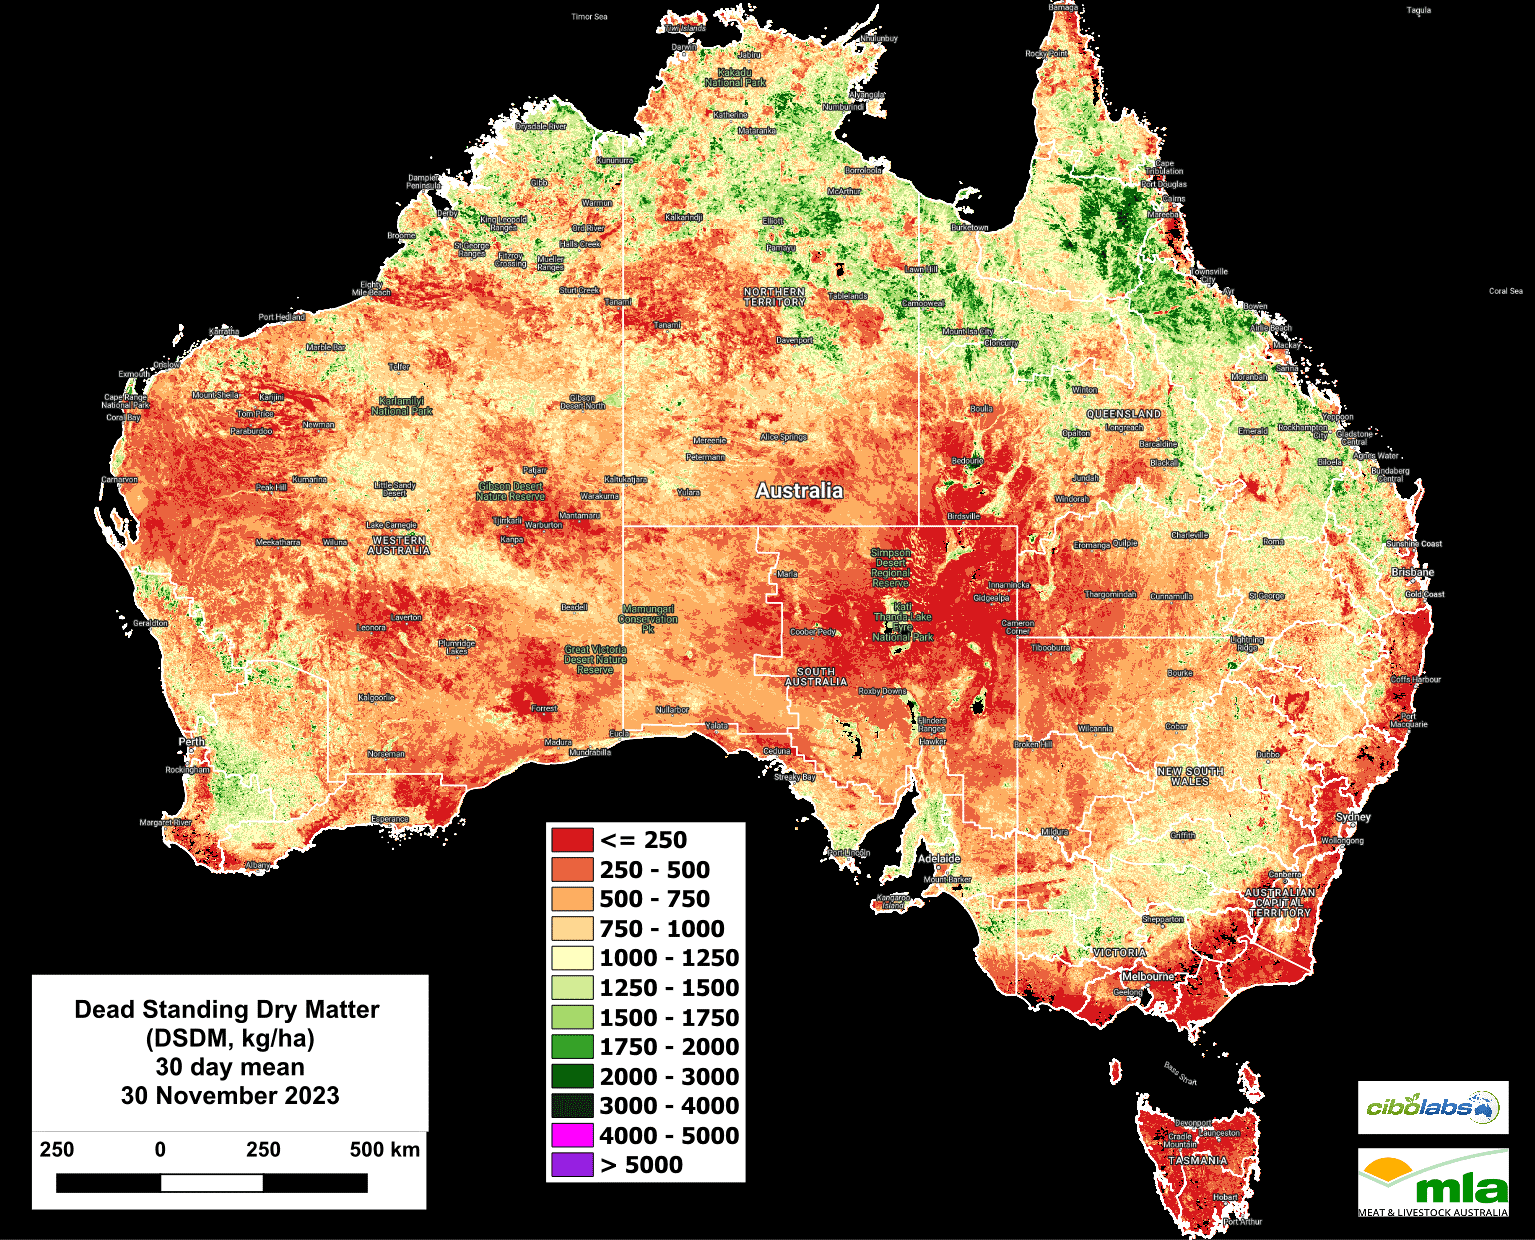
Image 5 – Dead Standing Dry Matter
Maturing winter crops in southeast NSW and into Victoria and South Australia are contributing to the higher levels of Dead Standing Dry Matter noticeable in the current images.
There has been a significant increase in the total amount of Dead Standing Dry Matter in these regions since the update of November 15, 2023.
A similar trend is also noticeable in the southeast and wheatbelt of Western Australia.
In the northern portion of NSW, and into Queensland and the Northern Territory there is a noticeable decline in levels of Dead Standing Dry Matter, reflecting (Image 5) dry matter loss from grazing and from detachment as the result of weather conditions, including rainfall events.
Monthly Ground Cover levels
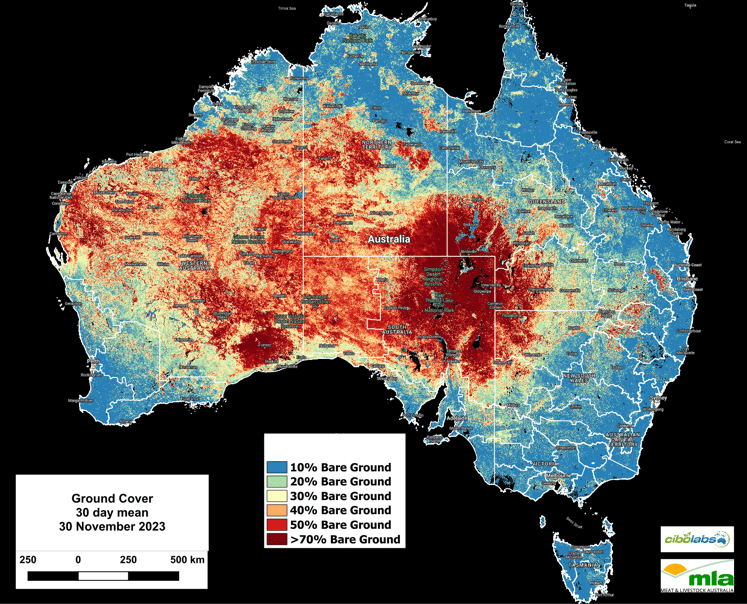
Image 6 – Ground Cover
National Ground Cover levels (30-day rolling average – Image 6) have started to change with an increase in bare area in the eastern Kimberley as well as increase to existing areas where ground cover is less than 50% in the Gascoyne and Pilbara regions.
The areas impacted by fire on the Barkley Tablelands of the Northern Territory and Southern Gulf of Queensland are still noticeable, again reflecting the time lag between rainfall events and significant biomass response.
It is important for users to note that these national images can be refined to provide more detail on a regional basis using the Cibo Labs Regional Comparison. This can be used to focus on regional level data which may show the impact of localised weather or fire events. A further level of detail for individual properties is available for users who have created an Australian Feedbase Monitor account, which can be accessed both through the MyMLA portal or through the Cibo Labs website.
The Cibo Labs National Comparison can be used to freely access these layers (https://www.cibolabs.com.au/products/national-comparsion/) to view the most recent images from a national, state or catchment level.
This tool can complement the Australian Feedbase Monitor which can also be created within the Cibo Labs Web Site www.cibolabs.com.au