Regional improvements driven by rainfall
National Summary
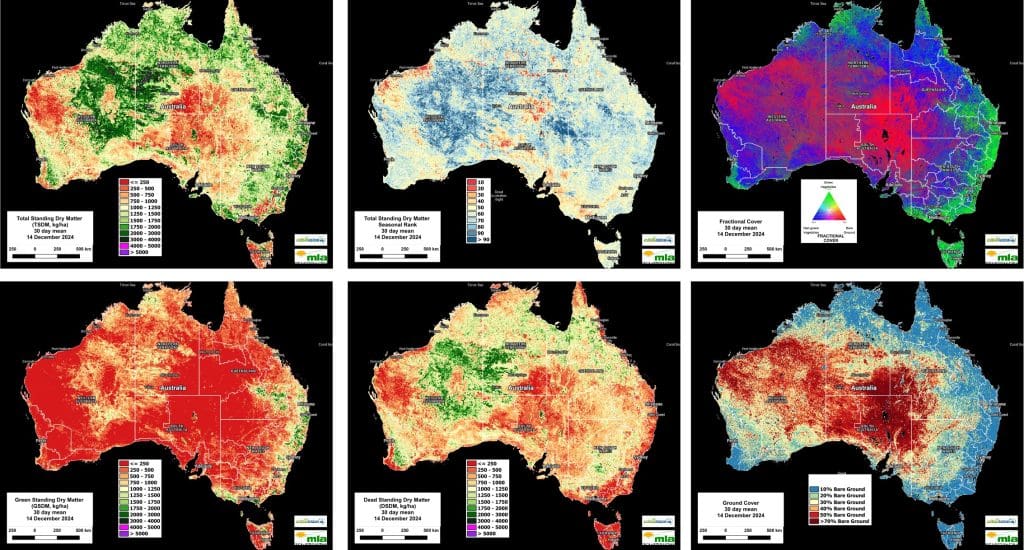
In December 2024, Australia’s feedbase conditions reflected significant regional improvements alongside persistent contrasts driven by rainfall and temperature variability. Widespread rainfall across eastern Australia, particularly in Queensland and New South Wales, enhanced biomass growth, with many areas surpassing 1000 kg/DM/ha and transitioning into the 1250–1500 kg/DM /ha range.
Northern Queensland and the Top End recorded notable growth, with some regions exceeding 2000 kg/DM/ha, reflecting substantial rainfall recovery.
In southwestern Western Australia, localized rainfall sustained moderate vegetation recovery along coastal areas; however, drying trends persisted inland, with biomass levels remaining below 750 kg/DM/ha. Central Australia continued to experience limited vegetation activity, with vast areas recording biomass below 500 kg/DM/ha due to persistent arid conditions.
The southeastern regions of Australia, including Victoria, Tasmania, and southeastern New South Wales, saw significant improvements in biomass growth driven by above-average rainfall.
Regions transitioned into the 1000–1500 kg/DM/ha range, with pockets of Tasmania exceeding 2000 kg/DM/ha, supporting dense ground cover and improving forage availability.
Meanwhile, above-average temperatures in parts of central and western Australia exacerbated drying trends, reducing soil moisture and hindering vegetation recovery. These regional differences highlight the ongoing interplay between rainfall, temperature, and biomass production, as illustrated in the latest feedbase maps.
![]()
Imagery and analysis provided by CiboLabs
Regional Trends in Biomass Growth
Total Standing Dry Matter (Kg/Ha)
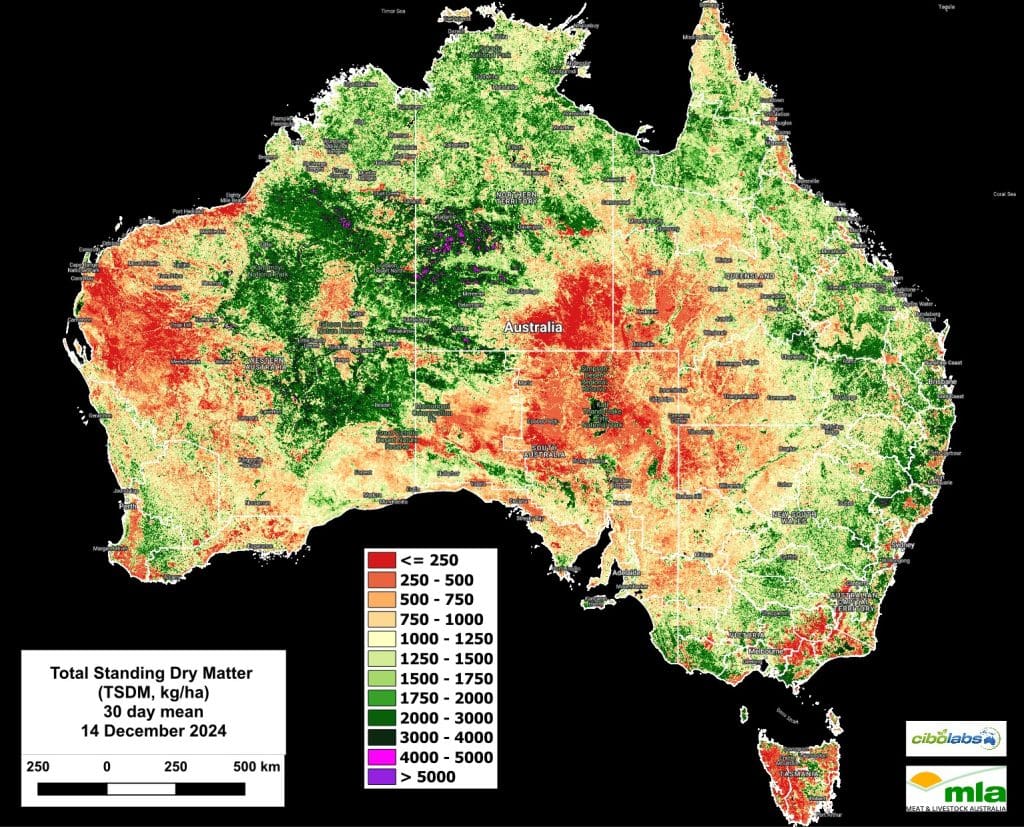
December highlighted notable improvements in feedbase conditions across Australia, alongside persistent regional contrasts:
- Eastern Australia: Widespread rainfall across Queensland and New South Wales significantly improved biomass levels. Many areas surpassed 1000 kg/DM/ha, with regions in northern Queensland and parts of New South Wales transitioning into the 1250–1500 kg/DM/ha range. This has enhanced forage availability, supporting grazing activities and further pasture recovery.
- Southwestern Western Australia: While localized rainfall sustained moderate vegetation recovery in coastal and near-coastal areas, biomass levels generally remained below 750 kg/DM/ha inland. Drying trends continued across much of the southwest, limiting further improvements and reflecting variable rainfall impacts.
- Central and Northern Australia: Northern regions, particularly the Top End and parts of northern Queensland, saw substantial rainfall-driven greening, with biomass levels exceeding 1000 kg/DM/ha in isolated areas. However, central Australia remains dominated by arid conditions, with large areas still recording biomass below 500 kg/DM/ha.
- Southeastern Australia: Above-average rainfall resulted in notable biomass increases across Victoria, Tasmania, and parts of southeastern New South Wales. Many regions transitioned into the 1000–1500 kg/DM/ha range, with pockets of Tasmania exceeding 2000 kg/DM/ha. This sustained ground cover and improved forage availability, supporting grazing operations and vegetation growth.
Decile Rankings and Seasonal Comparisons
Seasonal Comparison Total Standing Dry Matter
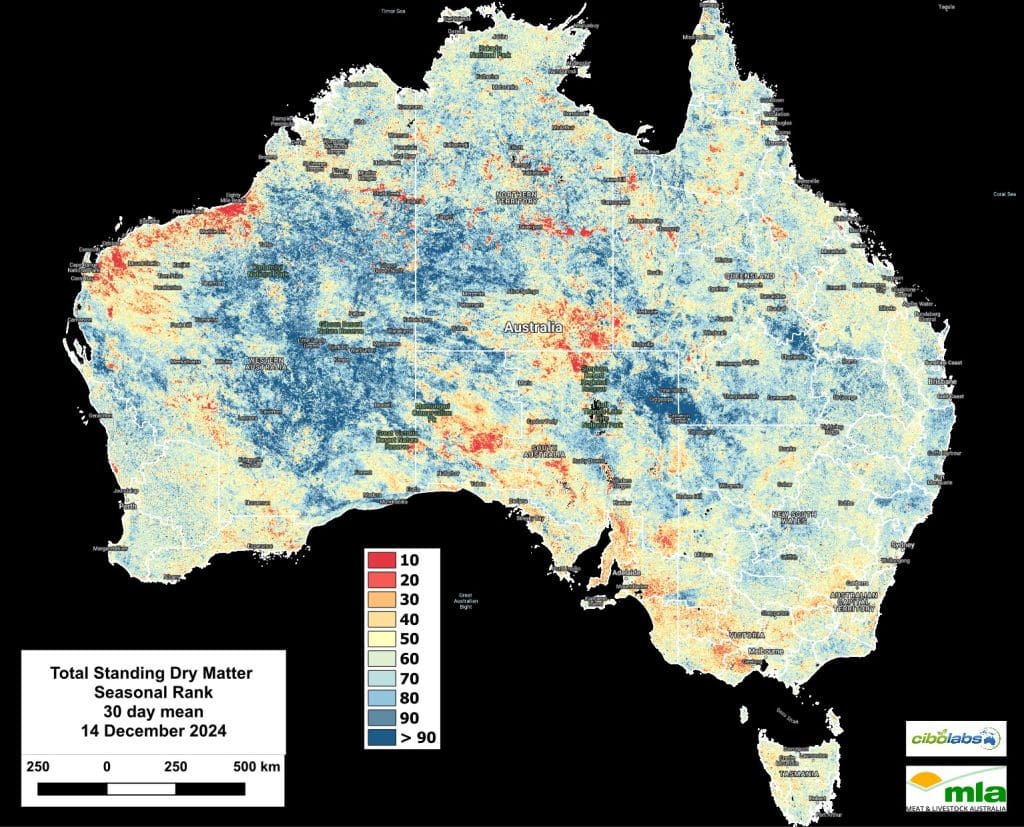
The TSDM Seasonal Rank maps, comparing November to mid-December 2024 conditions against the average of the past eight years, reveal significant trends:
Southeastern Australia: Vegetation improved notably in Victoria, southern New South Wales, and parts of Tasmania, with increased rainfall driving more areas into higher deciles (70–90). Pockets of eastern Victoria reached the >90th percentile, reflecting strong seasonal recovery.
Central Australia: Large areas remain in the lowest deciles (<10), with persistent arid conditions continuing to limit recovery. However, localized rainfall in parts of northern Central Australia resulted in slight improvements into the 20–30 decile range.
Northern Australia: Significant rainfall led to marked improvements in Queensland’s northern regions and parts of the Top End, with many areas shifting into mid-to-high deciles (50–80). These changes contrast with the earlier stability observed in November.
Southwestern Western Australia: Vegetation productivity continued to decline in inland and coastal regions, with areas previously in mid-range deciles (30–50) now shifting into the lowest deciles (<20).
These decile trends highlight substantial gains in southeastern and northern Australia due to recent rainfall, while central and southwestern regions continue to face challenges with limited biomass recovery.
Active Plant Growth: Fractional Cover Insights
Fractional Cover
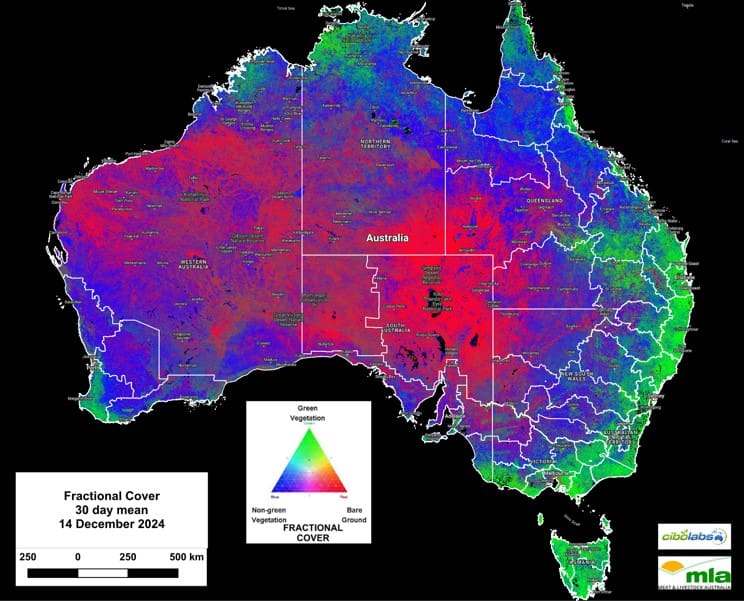
Fractional cover data, tracking active photosynthesis and plant growth, highlights notable changes in vegetation health between late November and mid-December 2024:
- Eastern Australia:Significant improvements in green vegetation are visible across New South Wales, Victoria, and eastern Queensland, with widespread green cover expansion driven by recent rainfall. These regions reflect increased photosynthesis and active plant growth, aligning with improved biomass levels.
- Northern Australia:Enhanced green cover is observed in northern Queensland and the Top End, reflecting improved rainfall conditions that have boosted vegetation activity.
- Southwestern Western Australia:Green vegetation remains concentrated along coastal areas, with slight increases in active plant growth following localized rainfall. However, inland regions continue to display dominant non-green cover and bare ground.
- Central Australia:Limited vegetation activity persists, with extensive non-green vegetation and bare ground dominating the region, indicative of ongoing arid conditions.
These patterns demonstrate the regional variability of vegetation responses, with eastern and northern areas showing strong recovery, while central and inland western regions remain constrained by limited rainfall and arid conditions.
Green Standing Dry Matter (GSDM): Vegetation Recovery Disparities
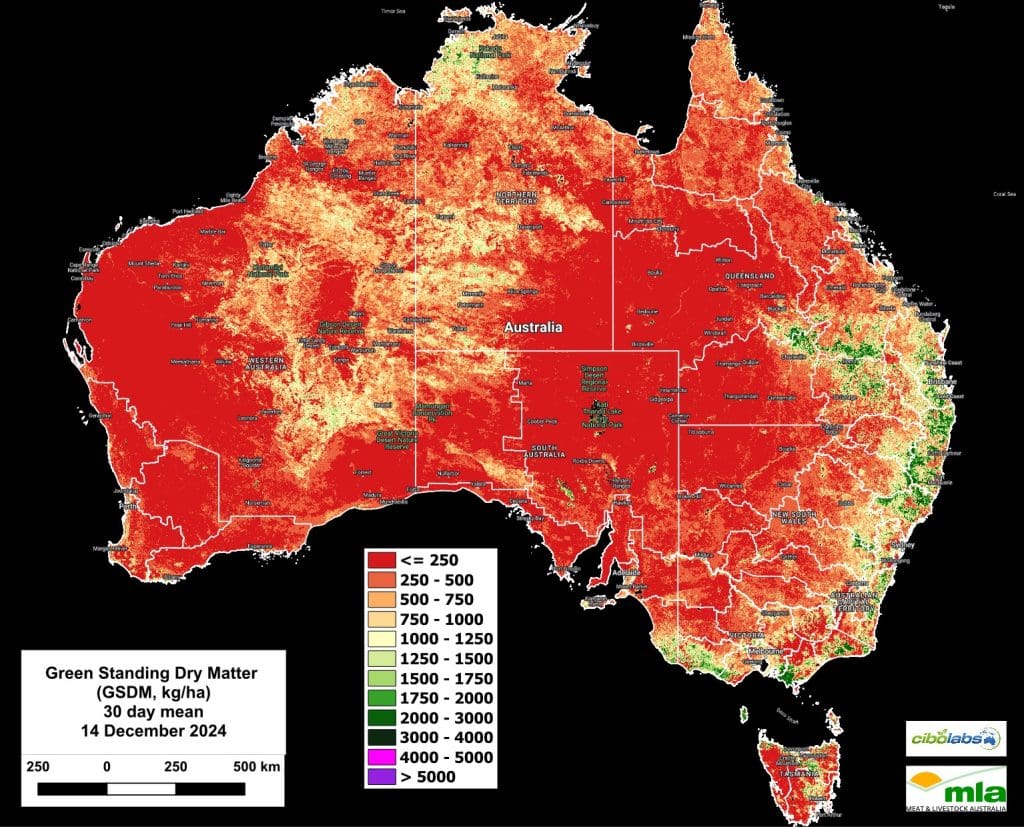
Green Standing Dry Matter
The GSDM maps for late November to mid-December 2024 illustrate ongoing disparities in green biomass recovery across regions:
Southeastern Australia: Significant gains were observed in eastern New South Wales, Victoria, and parts of Tasmania, with biomass levels ranging from 750 to 1500 kg/DM/ha. Southeastern Queensland saw notable improvements, with areas exceeding 1250 kg/DM/ha, driven by consistent rainfall.
Northern Australia: Improvements are evident in northern Queensland and localized pockets of the Top End, with green biomass levels reaching 500–1000 kg/DM/ha. However, large areas remain below 500 kg/DM/ha.
Southwestern Western Australia: Green biomass remains low, predominantly within the 250–500 kg/DM/ha range, indicating slow recovery. Coastal zones display limited gains, but inland areas show persistent deficits.
Central Australia: Green biomass levels remain critically low (≤ 250 kg/DM/ha), reflecting continued arid conditions and minimal vegetation recovery.
Tasmania and Southeastern New South Wales: While moderate biomass levels persist (500–1000 kg/DM/ha), recovery continues to lag other southeastern cropping zones, highlighting the variability in rainfall impacts.
These patterns emphasize strong vegetation responses in eastern and northern regions, while central and southwestern areas face ongoing challenges due to limited rainfall and arid conditions.
Dead Standing Dry Matter (DSDM): Variability Across Regions
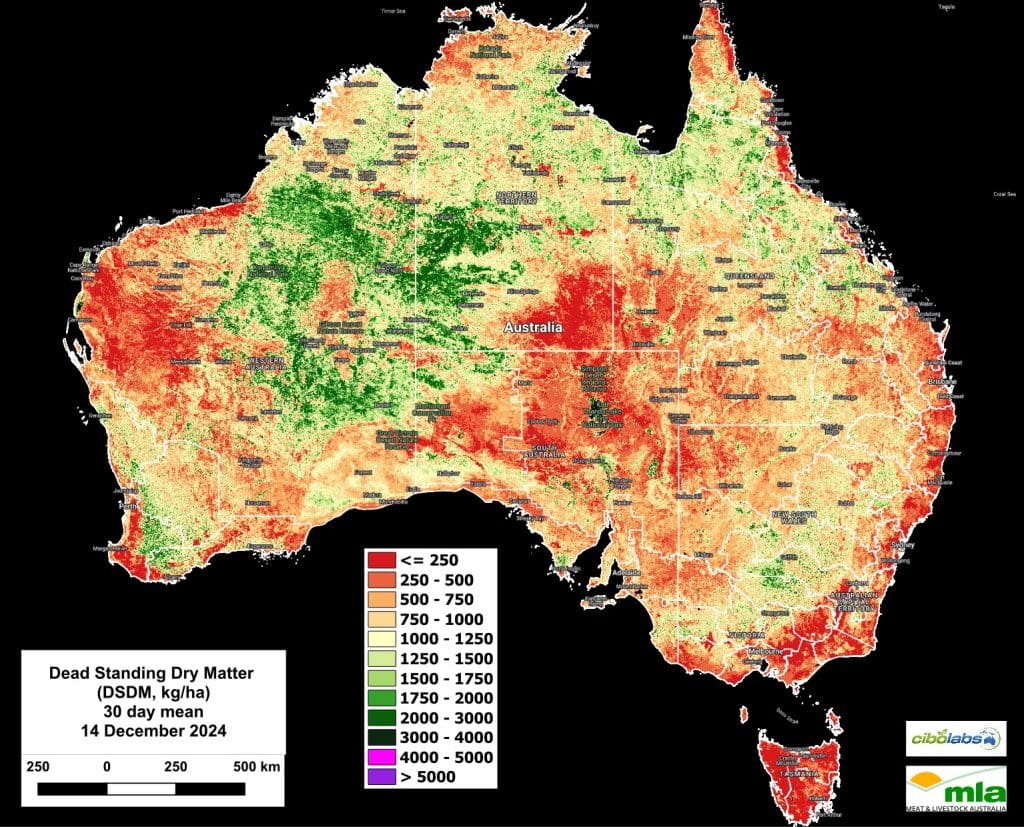
Dead Standing Dry Matter
The DSDM maps for late November to mid-December 2024 highlight significant regional changes driven by rainfall and vegetation dynamics:
Northern Australia: Central and northern Queensland experienced a notable reduction in dead biomass, dropping from 750–2000 kg/DM/ha to 250–500 kg/DM/ha, as rainfall promoted the transition to green biomass.
Southern States: Sparse dead biomass levels (<750 kg/DM/ha) persisted across Victoria, Tasmania, and parts of South Australia, indicating ongoing vegetation turnover and recovery following recent rainfall.
Central Australia: Dead biomass levels remained critically low (≤ 250 kg/DM/ha), consistent with persistent arid conditions and minimal plant material accumulation.
Southwestern Western Australia: Dead biomass increased moderately in localized areas, rising to 500–1000 kg/DM/ha, likely due to plant material accumulation following earlier dry conditions and limited recovery.
Western and Northern Western Australia: Scattered pockets of 750–1500 kg/DM/ha DSDM reflect residual plant material from earlier dry spells.
These patterns reveal dynamic shifts in dead biomass, particularly in northern Australia, where green biomass recovery is evident, while central and southwestern regions continue to experience limited improvements due to persistent aridity.
Ground Cover Contrasts
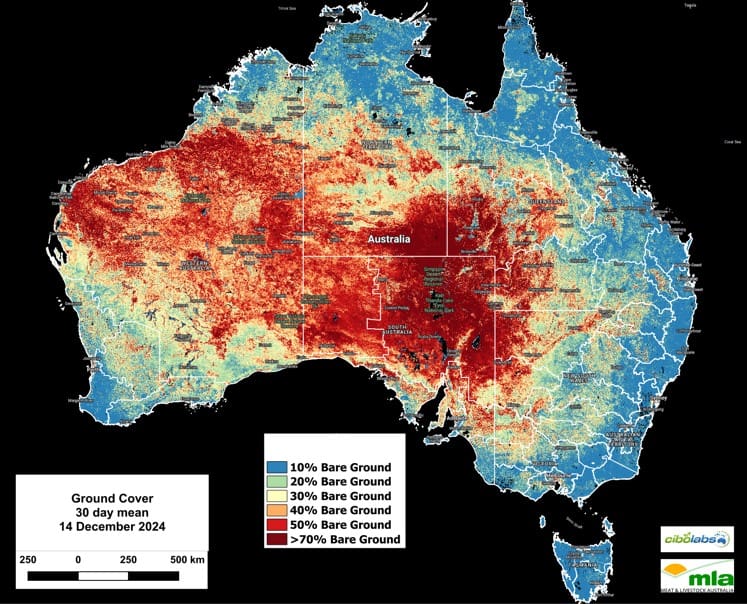
Ground Cover
Ground cover data for late November to mid-December 2024 reveals regional variability in bare ground expansion and vegetation density:
- Central Australia: Extensive areas of bare ground persist, with large regions exceeding 50–70% bare ground, reflecting ongoing arid conditions and minimal recovery.
- Western Australia:Significant bare ground expansion occurred, particularly in the interior and northern regions, with many areas now recording 40–50% bare ground and pockets exceeding 70%.
- Northern Australia: While ground cover remains relatively stable overall, localized increases in bare ground are evident, with some areas shifting from 20–30% to 30–40% bare ground due to recent drying trends.
- Southeastern Australia: Dense vegetation cover continues to dominate Victoria and New South Wales, with most areas maintaining <20% bare ground, supported by favourable rainfall.
- Southwestern Western Australia: Drying conditions have led to an increase in bare ground, with regions shifting from 10–20% to 30–40% bare ground, particularly inland.
These maps emphasize the stark contrasts between the dense ground cover in southeastern Australia and the widespread bare ground expansion in arid central and western regions, driven by persistent dry conditions and limited vegetation recovery.
Cibo Labs Regional Comparison
For more localised information including regional level overviews, users are encouraged to explore the Cibo Labs Regional Comparison. This tool provides regional data that may show the impact of localised weather or fire events. A further level of detail for individual properties is available for users who have created an Australian Feedbase Monitor account, which can be accessed both through the MyMLA portal or through the Cibo Labs website. These tools enable land managers to make data-informed decisions tailored to their unique feedbase conditions and needs.
The Cibo Labs National Comparison can be used to freely access these layers (https://www.cibolabs.com.au/products/national-comparsion/) to view the most recent images from a national, state or catchment level.
This tool can complement the Australian Feedbase Monitor which can also be created within the Cibo Labs Web Site www.cibolabs.com.au