National Summary
As of January 2025, Australia’s feedbase conditions reflect a dynamic interplay of rainfall, temperature variability, and drought, driving significant regional contrasts in biomass production, ground cover, and water availability.
Widespread rainfall across eastern Australia, particularly in Queensland and New South Wales, has continued to support biomass growth. Many areas now surpass 1250–1500 kg/DM/ha, with pockets in northern Queensland and the Top End exceeding 2000 kg/DM/ha due to substantial rainfall recovery. These regions benefit from enhanced ground cover and improved forage availability, helping sustain livestock production. However, localized increases in bare ground in parts of northern Queensland highlight the variability of rainfall distribution, which could challenge long-term vegetation recovery.
In contrast, southern and western Australia are facing ongoing drought conditions and limited recovery:
- Southwestern Western Australia: TSDM, GSDM, and ground cover levels remain largely unchanged, reflecting persistent arid conditions and rainfall deficits. Coastal areas show minor improvements in biomass, but interior regions remain critically dry, with ground cover exceeding 50–70% bare ground in many areas.
- South Australia: Conditions remain critical, with no substantial changes since December. TSDM and GSDM levels are very low, particularly in central and northern areas, while southeastern regions show slight but variable improvements. Bare ground remains widespread, exceeding 50% in most regions and 70% in some areas, reflecting the severity of drought impacts.
- Western Victoria: Emerging dry spells have caused slight declines in TSDM and GSDM, particularly in the Wimmera and Mallee regions. Bare ground has increased in western parts, now reaching 30–40% in some areas, highlighting the growing stress on vegetation and soil moisture.
While rainfall in northern and eastern Australia has driven localized improvements in vegetation and forage availability, regions like southwestern Western Australia, South Australia, and western Victoria continue to grapple with severe drought conditions, reduced water storage, and limited recovery. These conditions underscore the stark regional disparities in feedbase conditions, with drought-affected areas facing ongoing challenges in sustaining agricultural productivity.
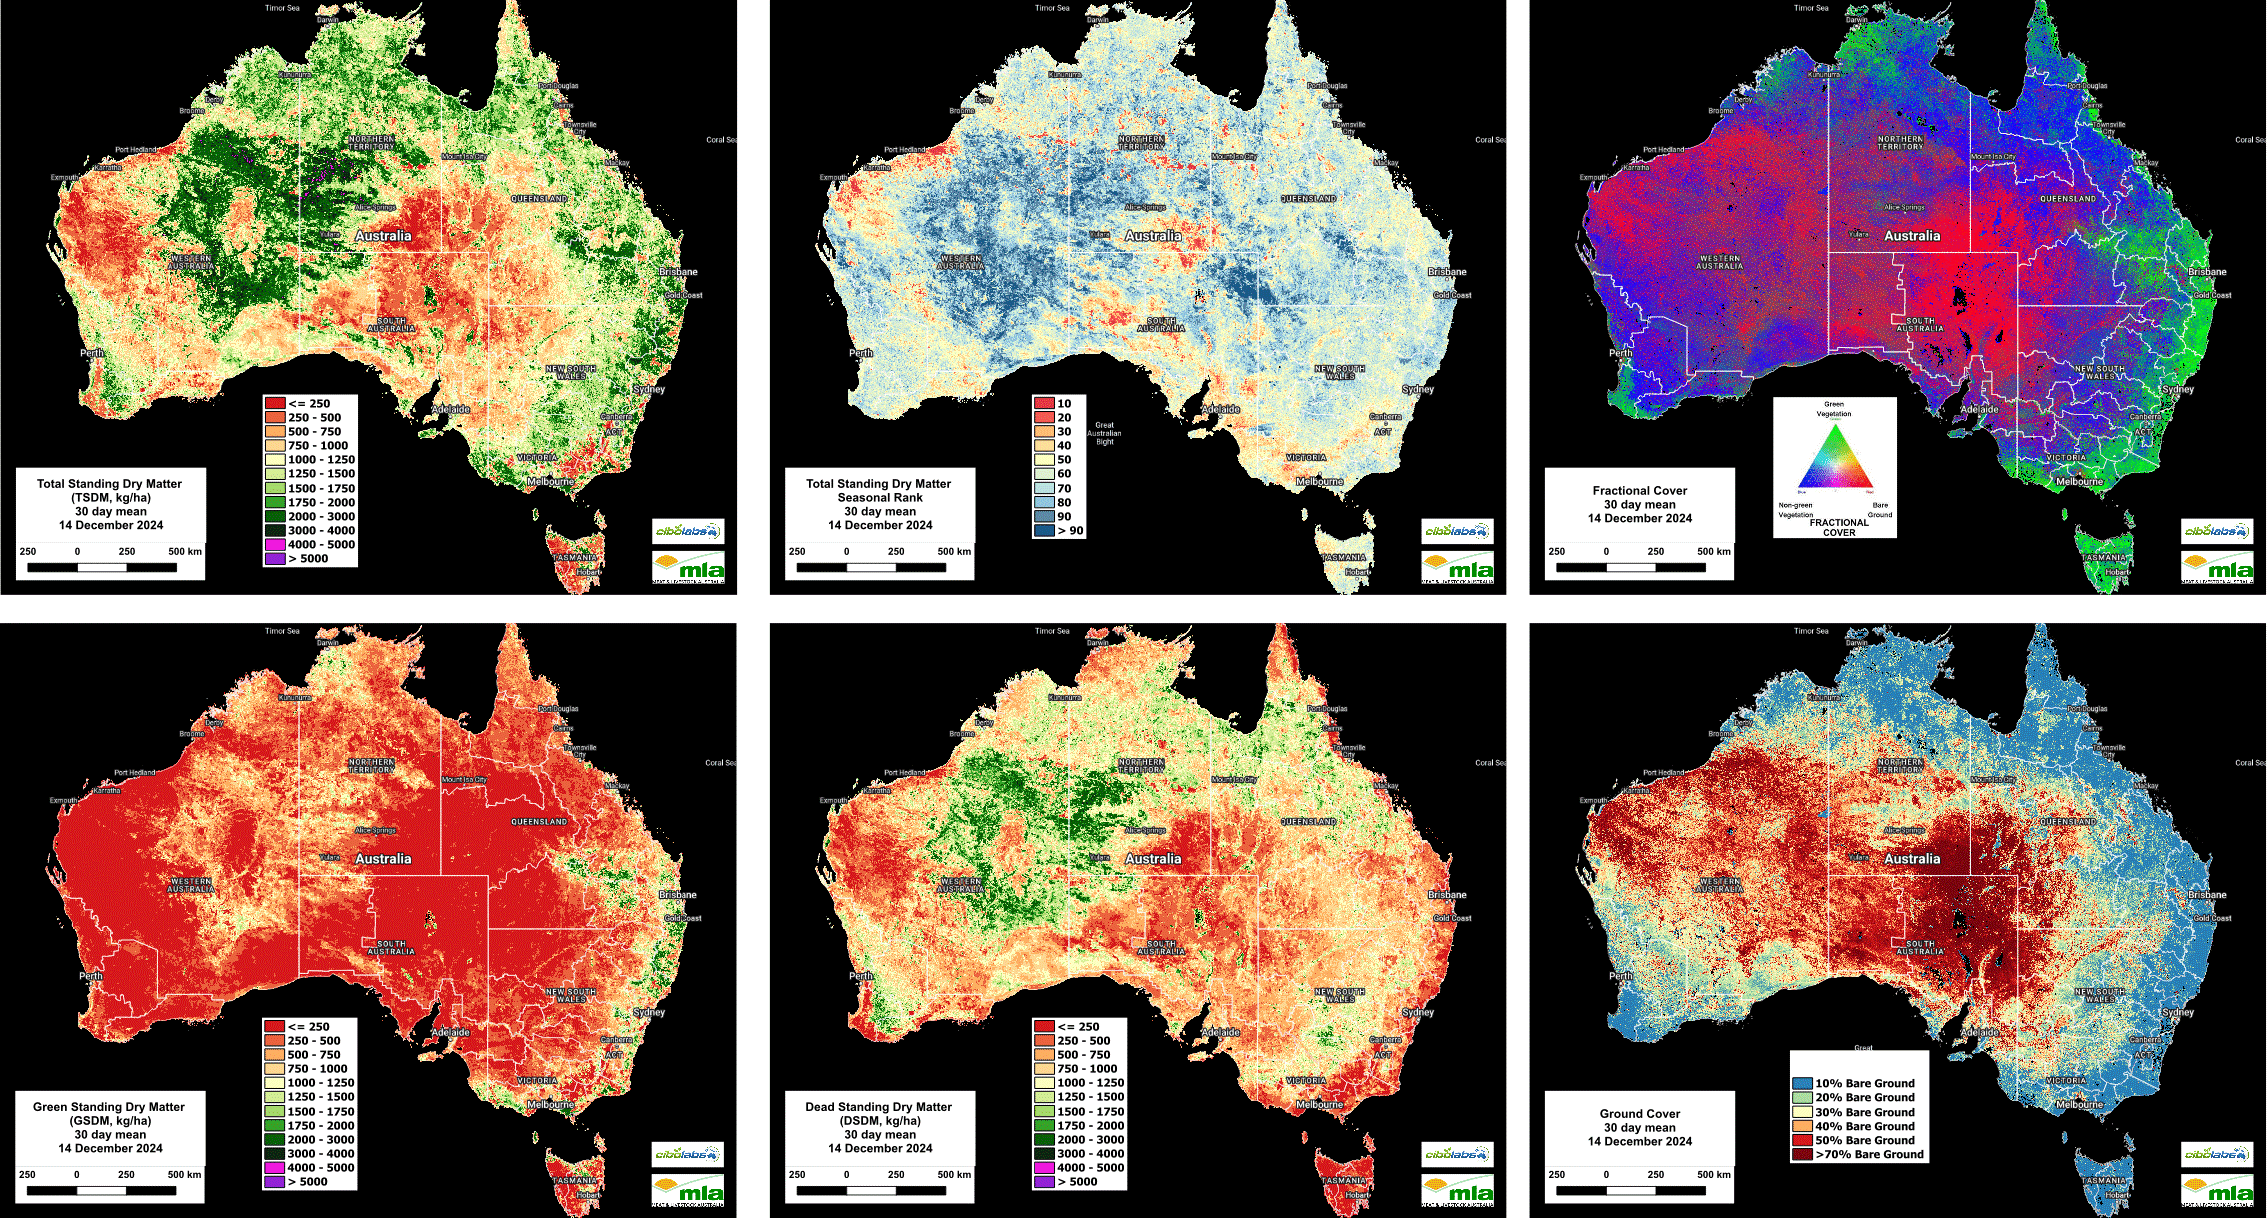
![]()
Imagery and analysis provided by CiboLabs
Regional Trends in Biomass Growth
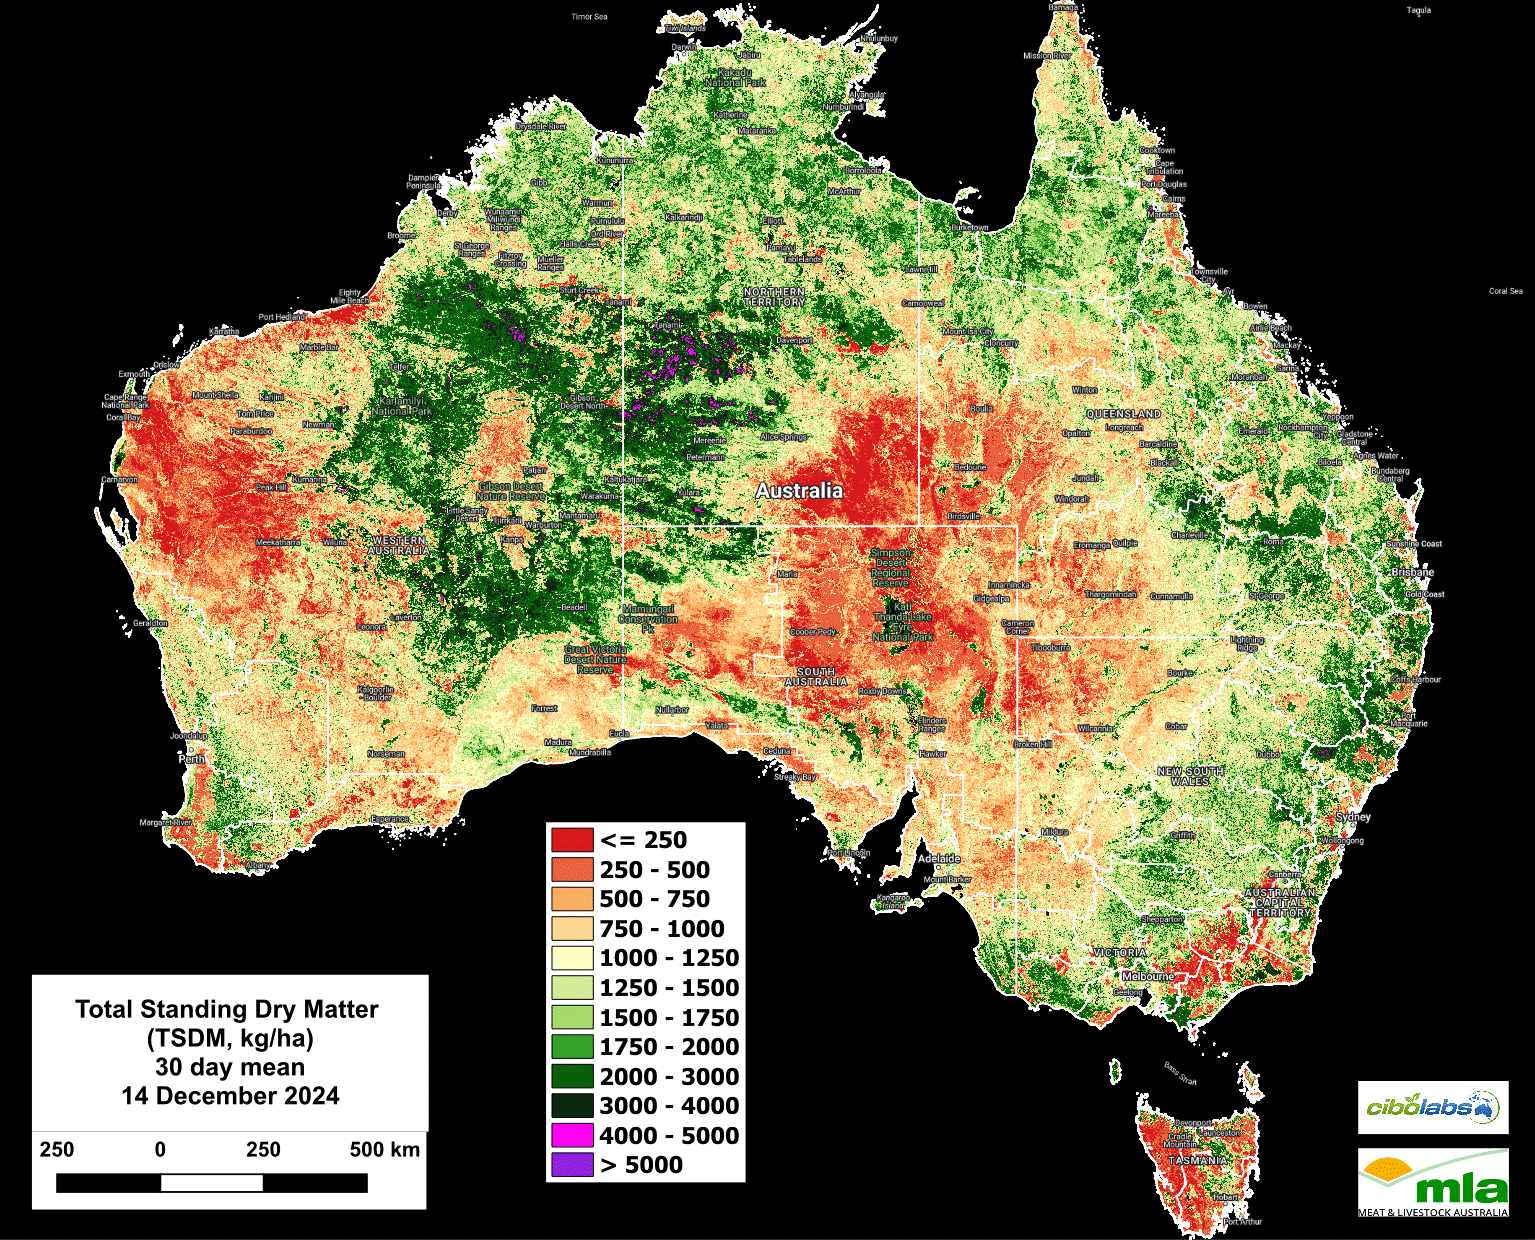
Image 1 – Total Standing Dry Matter (Kg/Ha)
January demonstrated both continued improvements and persistent contrasts in feedbase conditions across Australia:
- Eastern Australia: Widespread rainfall in Queensland and New South Wales further boosted biomass levels. Many areas in northern Queensland and parts of New South Wales now consistently surpass 1500 kg/DM/ha, with some regions transitioning into the 1750–2000 kg/DM/ha range. This sustained improvement supports grazing activities and enhances pasture recovery potential.
- Southwestern Western Australia: Inland areas continue to face challenges with biomass levels largely below 750 kg/DM/ha, and little improvement is visible. Coastal and near-coastal areas experienced modest vegetation recovery, supported by localized rainfall. Drying trends persist, reflecting limited overall improvement in forage availability.
- Central and Northern Australia: The Top End and northern Queensland recorded significant rainfall-driven greening, with more regions surpassing 1000 kg/DM/ha and isolated areas exceeding 1500 kg/DM/ha. However, central Australia remains dominated by arid conditions, with the majority of areas still below 500 kg/DM/ha, indicating persistent challenges in feed availability.
- Southeastern Australia: Continued above-average rainfall resulted in widespread biomass increases across Victoria, Tasmania, and southeastern New South Wales. Many regions are now firmly in the 1250–2000 kg/DM/ha range, with pockets in Tasmania exceeding 3000 kg/DM/ha. This substantial improvement supports grazing operations, enhances ground cover, and encourages further vegetation growth.
Decile Rankings and Seasonal Comparisons
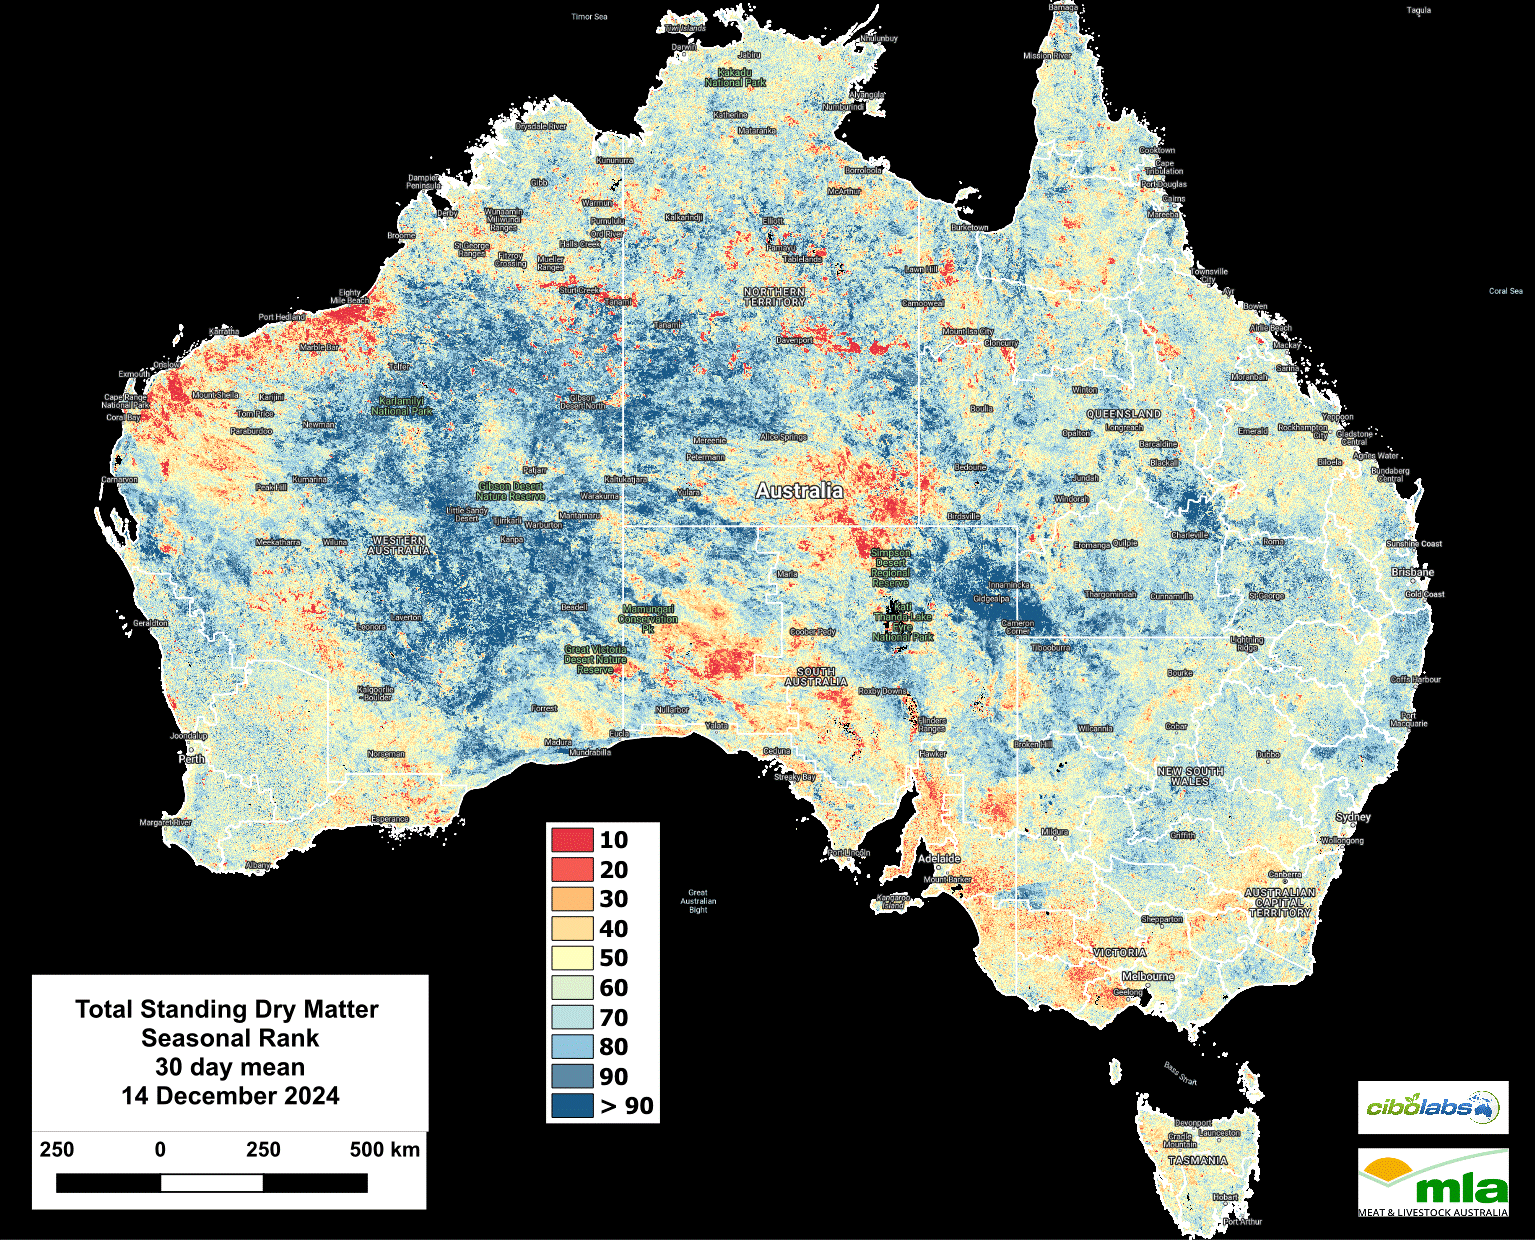
Image 2 – Seasonal Comparison Total Standing Dry Matter
The TSDM Seasonal Rank maps, comparing December 2024 to January 2025 conditions against the average of the past eight years, reveal significant trends:
- Southeastern Australia: Vegetation continues to show notable improvement across Victoria, southern New South Wales, and Tasmania. In particular, southwest Victoria experienced further gains, with many areas now in the 70–90 decile range and pockets reaching the >90th percentile, reflecting exceptional seasonal recovery. This improvement has been driven by sustained above-average rainfall and favorable growing conditions.
- South Australia: Trends across South Australia are more mixed. While the southeast corner mirrors southwest Victoria’s positive trajectory into higher deciles (70–90), much of the state’s interior remains in lower deciles (10–30), reflecting limited recovery due to insufficient rainfall. Some localized rainfall events contributed to slight improvements in isolated areas.
- Central Australia: Persistent arid conditions continue to dominate, keeping large areas in the lowest deciles (<10). However, small pockets in northern Central Australia have shifted into the 20–30 decile range due to localized rainfall.
- Northern Australia: Significant rainfall has driven marked improvements across northern Queensland and the Top End. Many areas have moved into mid-to-high deciles (50–80), contrasting with the stability observed in previous months. These changes indicate a robust response to recent rainfall events.
- Southwestern Western Australia: Vegetation productivity has declined further in inland and coastal regions, with many areas slipping into the lowest deciles (<20). This decline reflects ongoing drying trends and limited rainfall during this period.
These decile trends highlight strong gains in southeastern and northern Australia, driven by sustained rainfall, while central and southwestern regions continue to struggle with limited biomass recovery. The pronounced improvements in southwest Victoria and southeastern South Australia stand out as key areas of seasonal recovery.
Active Plant Growth: Fractional Cover Insights
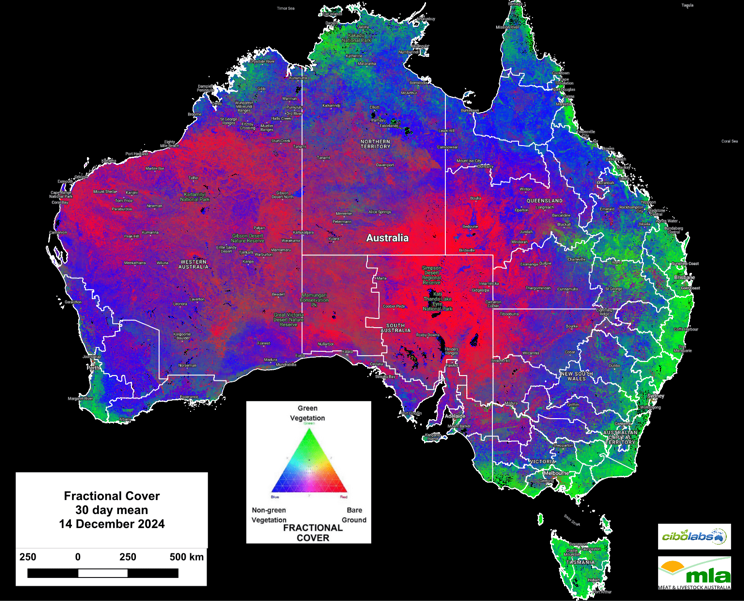
Image 3 – Fractional Cover
Fractional cover data, tracking active photosynthesis and plant growth, highlights notable changes in vegetation health between mid-December 2024 and mid-January 2025:
- Eastern Australia: Significant improvements in green vegetation continue across New South Wales, Victoria, and eastern Queensland. Widespread green cover expansion reflects sustained photosynthesis and active plant growth, aligning with recent rainfall and improved biomass levels. In southwest Victoria, green vegetation density has increased notably, with vegetation responding strongly to above-average rainfall, further enhancing forage availability.
- South Australia: Vegetation trends are mixed. While southeastern South Australia, particularly the southern coastal regions, shows increases in green vegetation and active plant growth, much of the interior remains dominated by non-green vegetation and bare ground. Rainfall in isolated areas has driven localized improvements, but overall vegetation health remains constrained.
- Northern Australia: Enhanced green cover is maintained across northern Queensland and the Top End. Recent rainfall continues to support active vegetation growth, with many areas sustaining strong photosynthetic activity.
- Southwestern Western Australia: Green vegetation remains concentrated in coastal areas, with limited further improvements observed. Inland regions remain dominated by non-green vegetation and bare ground, indicative of persistent arid conditions and insufficient rainfall to support widespread recovery.
- Central Australia: Limited vegetation activity persists, with extensive non-green vegetation and bare ground continuing to dominate the region. Minimal rainfall has constrained any potential recovery.
These patterns demonstrate the ongoing variability of vegetation responses. While eastern and northern regions show sustained recovery driven by recent rainfall, central Australia and inland South Australia face persistent challenges with limited rainfall and arid conditions. Notably, southwest Victoria and southeastern South Australia stand out as areas of marked improvement, reflecting localized rainfall-driven recovery.
Green Standing Dry Matter (GSDM): Vegetation Recovery Disparities
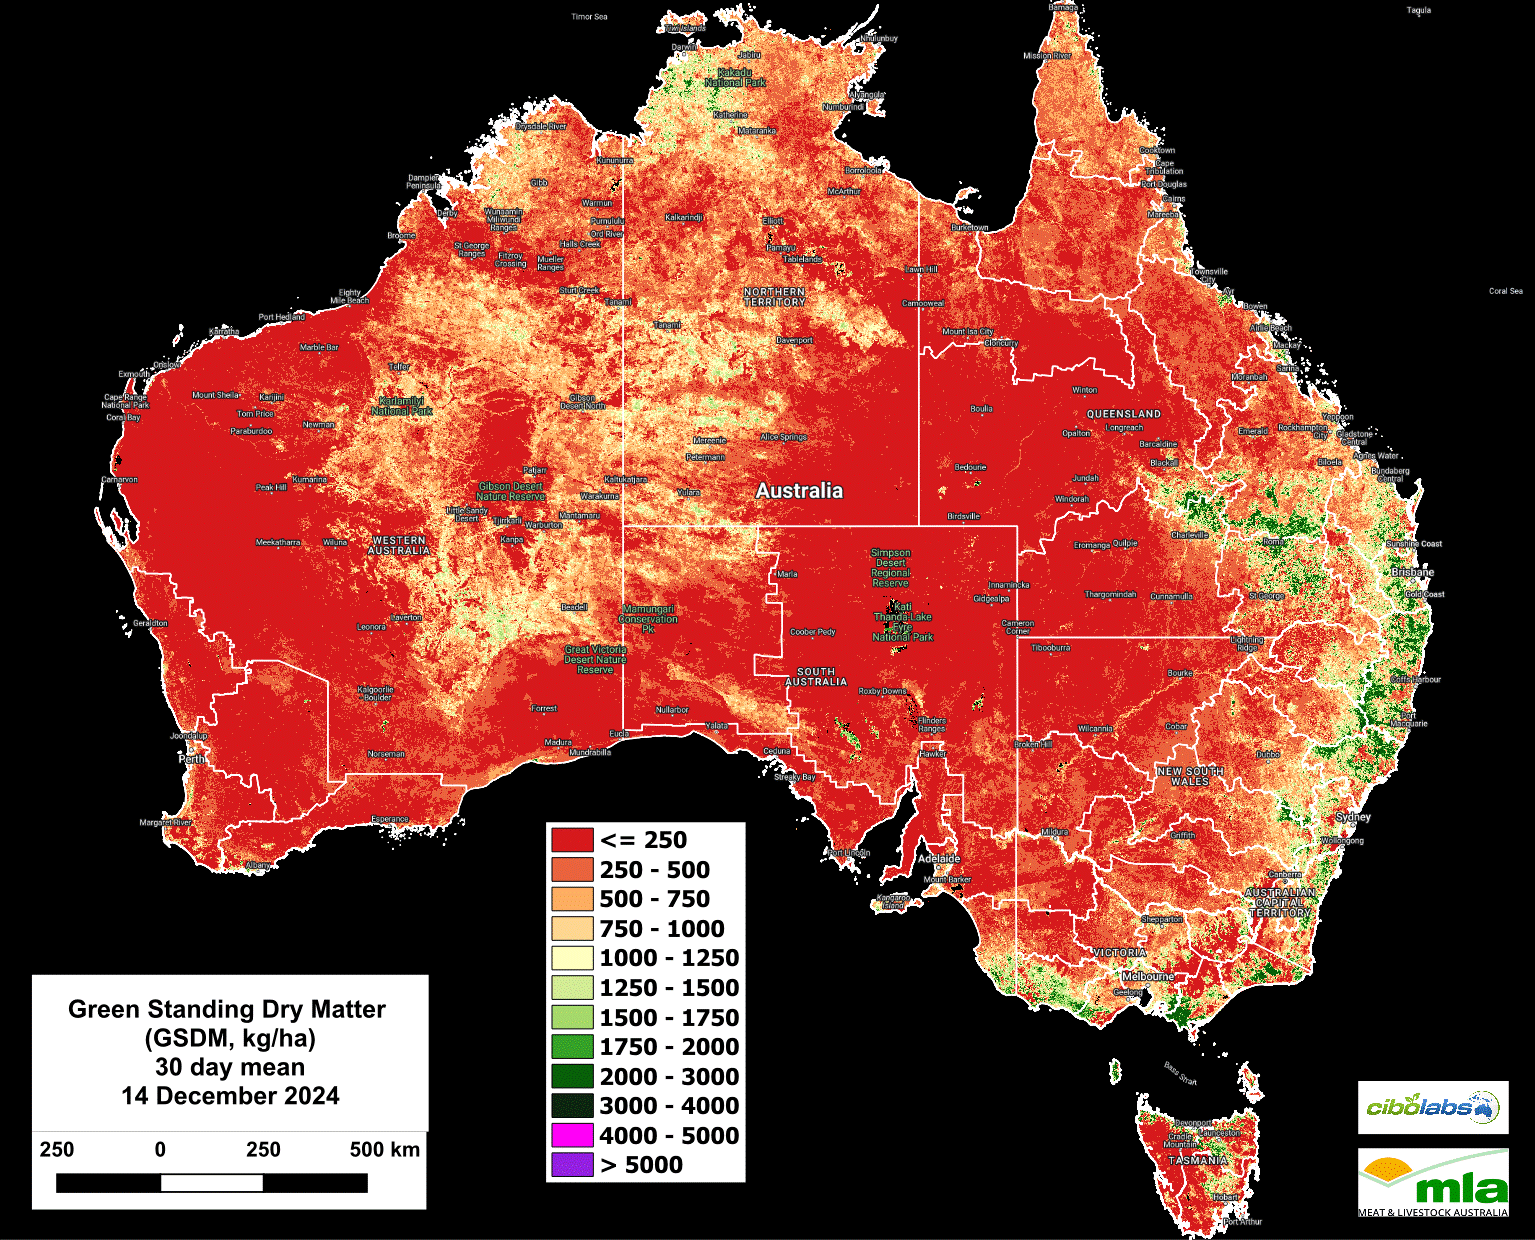
Image 4 – Green Standing Dry Matter
The GSDM maps for mid-December 2024 to mid-January 2025 illustrate ongoing disparities in green biomass recovery across regions and highlight significant implications for feed quality and livestock production:
- Southeastern Australia: Continued gains were observed across eastern New South Wales, Victoria, and Tasmania. Biomass levels in many areas now range from 1000 to 1750 kg/DM/ha, with pockets in southwest Victoria exceeding 2000 kg/DM/ha, driven by sustained rainfall and favorable growth conditions. Southeastern Queensland also shows further improvements, with areas consistently exceeding 1500 kg/DM/ha, reflecting robust recovery. These regions are better positioned to meet livestock energy and protein needs due to the increased availability of green, nutrient-rich biomass, reducing reliance on supplementation.
- Northern Australia: Enhanced green biomass levels are visible across northern Queensland and parts of the Top End, with many areas now reaching 750–1250 kg/DM/ha. However, significant portions of these regions remain below 500 kg/DM/ha, emphasizing ongoing variability in rainfall distribution and vegetation response. The limited green biomass in these areas restricts the availability of high-quality feed, likely requiring producers to introduce supplements to maintain livestock performance.
- Southwestern Western Australia: Green biomass recovery remains limited, predominantly within the 250–750 kg/DM/ha range. Coastal zones exhibit slight gains, but inland areas show persistent deficits, with biomass levels often below 500 kg/DM/ha, reflecting minimal response to recent rainfall. The dominance of dry, non-green vegetation in these areas suggests low feed quality, forcing producers to rely heavily on supplementary feeding to meet the energy and protein needs of livestock.
- Central Australia: Green biomass levels continue to be critically low (≤ 250 kg/DM/ha), indicating persistent arid conditions and minimal vegetation recovery across much of the region. This severely restricts feed quality and availability, presenting significant challenges for livestock production. Producers in these regions face limited options for grazing and will likely incur high costs for supplemental feed.
- Tasmania and Southeastern South Australia: Moderate biomass levels persist (750–1250 kg/DM/ha) across much of Tasmania and southeastern South Australia. While recovery is apparent in localized pockets, these regions continue to trail other southeastern zones in biomass improvement due to rainfall variability. The lower levels of green biomass in these areas may limit the energy and protein available to livestock, necessitating careful grazing management or supplementation to maintain productivity.
These patterns highlight strong vegetation responses in southeastern and northern regions, particularly in southwest Victoria and southeastern Queensland, where rainfall has driven significant biomass recovery. In contrast, central and southwestern areas face continued challenges with limited rainfall and slow recovery, maintaining critically low green biomass levels.
The disparity between TSDM and green biomass underscores the importance of assessing feed composition, as regions with low green biomass will struggle to provide adequate energy and protein, restricting livestock productivity and increasing reliance on supplementary feeding.
Dead Standing Dry Matter (DSDM): Variability Across Regions
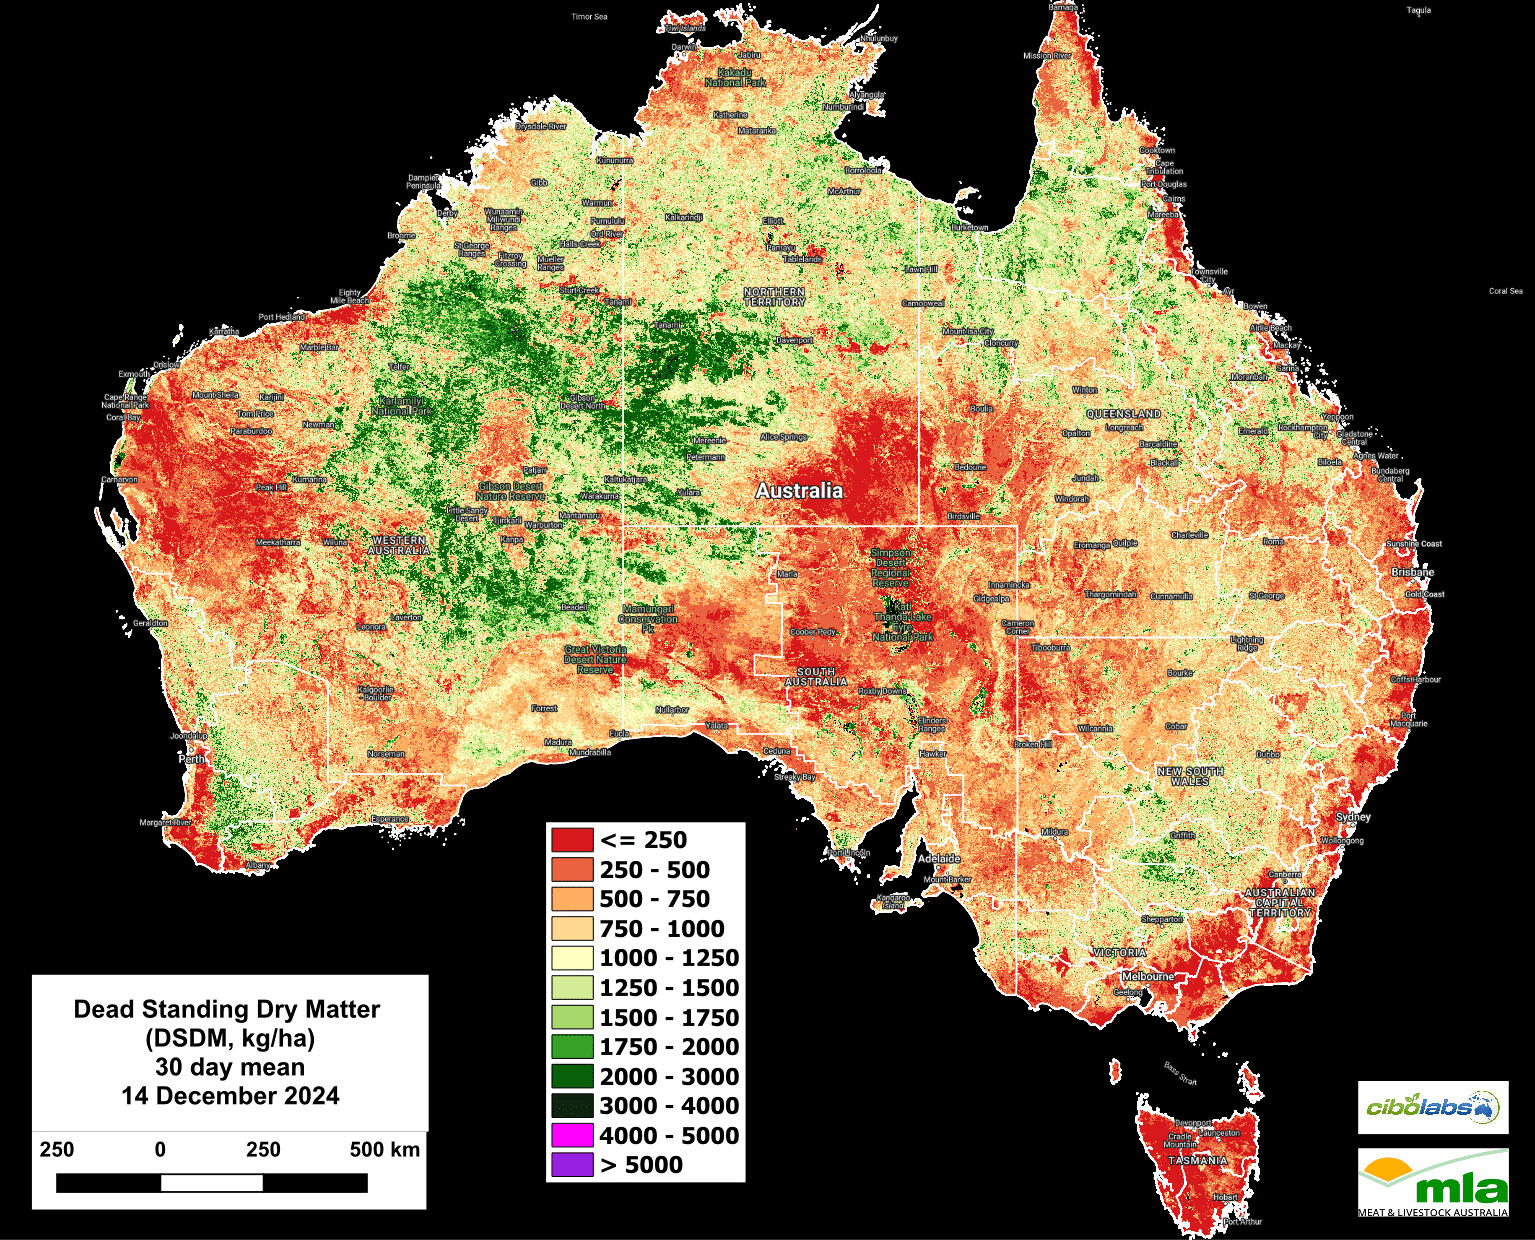
Image 5 – Dead Standing Dry Matter
The DSDM maps for mid-December 2024 to mid-January 2025 highlight significant regional changes driven by rainfall and vegetation dynamics, alongside challenges posed by high proportions of dead standing material:
- Northern Australia: Central and northern Queensland experienced a further reduction in dead biomass, with levels dropping from 750–2000 kg/DM/ha to 250–750 kg/DM/ha. This reflects the transition to green biomass driven by recent rainfall. However, areas with remaining dead biomass may still pose challenges for livestock production due to the lower digestibility and nutrient content compared to green vegetation.
- Southern States: Sparse dead biomass levels (<750 kg/DM/ha) persisted across Victoria, Tasmania, and parts of South Australia, indicating ongoing vegetation turnover and recovery. In southwest Victoria and southeastern South Australia, dead material is being replaced by green biomass, supporting better feed quality. However, areas with residual dead material could restrict livestock production by providing feed with limited energy and protein content.
- Central Australia: Dead biomass levels remained critically low (≤ 250 kg/DM/ha), consistent with persistent arid conditions and minimal plant material accumulation. While this limits the quantity of feed available, the quality remains poor, further restricting livestock productivity in this region.
- Southwestern Western Australia: Dead biomass increased moderately in localized areas, rising to 500–1000 kg/DM/ha. This accumulation reflects the persistence of dry conditions and limited recovery, leaving producers reliant on lower-quality feed for livestock.
- Western and Northern Western Australia: Scattered pockets of 750–1500 kg/DM/ha dead biomass reflect residual plant material from earlier dry spells. The dominance of dead standing material highlights the lack of green vegetation and the associated challenges of low nutrient availability for livestock.
While regions like northern Queensland and southwest Victoria are transitioning towards green biomass and higher feed quality, areas such as central Australia and southwestern Western Australia remain dominated by dead material. This contrast underscores the importance of both rainfall and vegetation composition in determining feed availability and quality for livestock production.
Ground Cover Contrasts
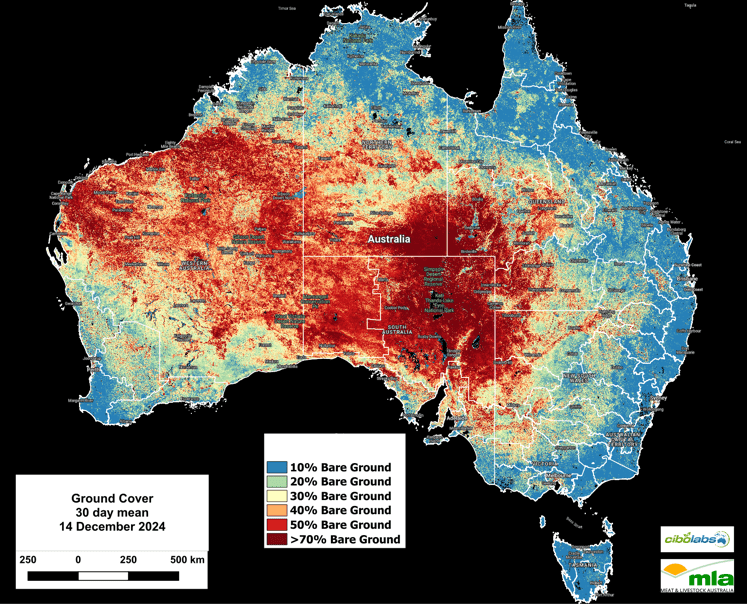
Image 6 – Ground Cover
Ground cover data for mid-December 2024 to mid-January 2025 highlights ongoing regional variability in bare ground expansion and vegetation density:
- Central Australia: Extensive areas of bare ground persist, with large regions continuing to exceed 50–70% bare ground. This reflects ongoing arid conditions and minimal recovery, posing significant challenges for erosion control and livestock production due to the lack of protective ground cover.
- Western Australia: Bare ground expansion remains significant, particularly in the interior and northern regions. Many areas now record 50–70% bare ground, with some pockets exceeding 70%. Limited rainfall and persistent dry conditions continue to hinder vegetation recovery.
- Northern Australia: Ground cover has remained relatively stable overall, but localized increases in bare ground are evident. Some areas have shifted from 20–30% to 30–40% bare ground, driven by drying trends in regions that missed out on recent rainfall events. This increase could reduce forage availability and expose soils to erosion.
- Southeastern Australia: Dense vegetation cover dominates Victoria, New South Wales, and southeastern Queensland, with most areas maintaining <20% bare ground. Favorable and consistent rainfall has supported ground cover retention, reducing erosion risk and supporting livestock grazing systems.
- Southwestern Western Australia: Drying conditions have led to a noticeable increase in bare ground, with regions shifting from 20–30% to 40–50% bare ground, particularly in inland areas. This trend reflects limited rainfall and ongoing challenges in maintaining vegetation cover.
For more localised information including regional level overviews, users are encouraged to explore the Cibo Labs Regional Comparison. This tool provides regional data that may show the impact of localised weather or fire events. A further level of detail for individual properties is available for users who have created an Australian Feedbase Monitor account, which can be accessed both through the MyMLA portal or through the Cibo Labs website. These tools enable land managers to make data-informed decisions tailored to their unique feedbase conditions and needs.
The Cibo Labs National Comparison can be used to freely access these layers (https://www.cibolabs.com.au/products/national-comparsion/) to view the most recent images from a national, state or catchment level.
This tool can complement the Australian Feedbase Monitor which can also be created within the Cibo Labs Web Site www.cibolabs.com.au