The gradual decline in national biomass levels which has been a feature of recent updates now appears to have eased with robust growth events on the back of recent storms and rainfall events across Northern NSW, Queensland, and the Northern Territory.
Biomass growth has seen a noticeable increase in these states.
This is positive news for many eastern states and northern graziers & land managers who have been watching for a seasonal break for many weeks.
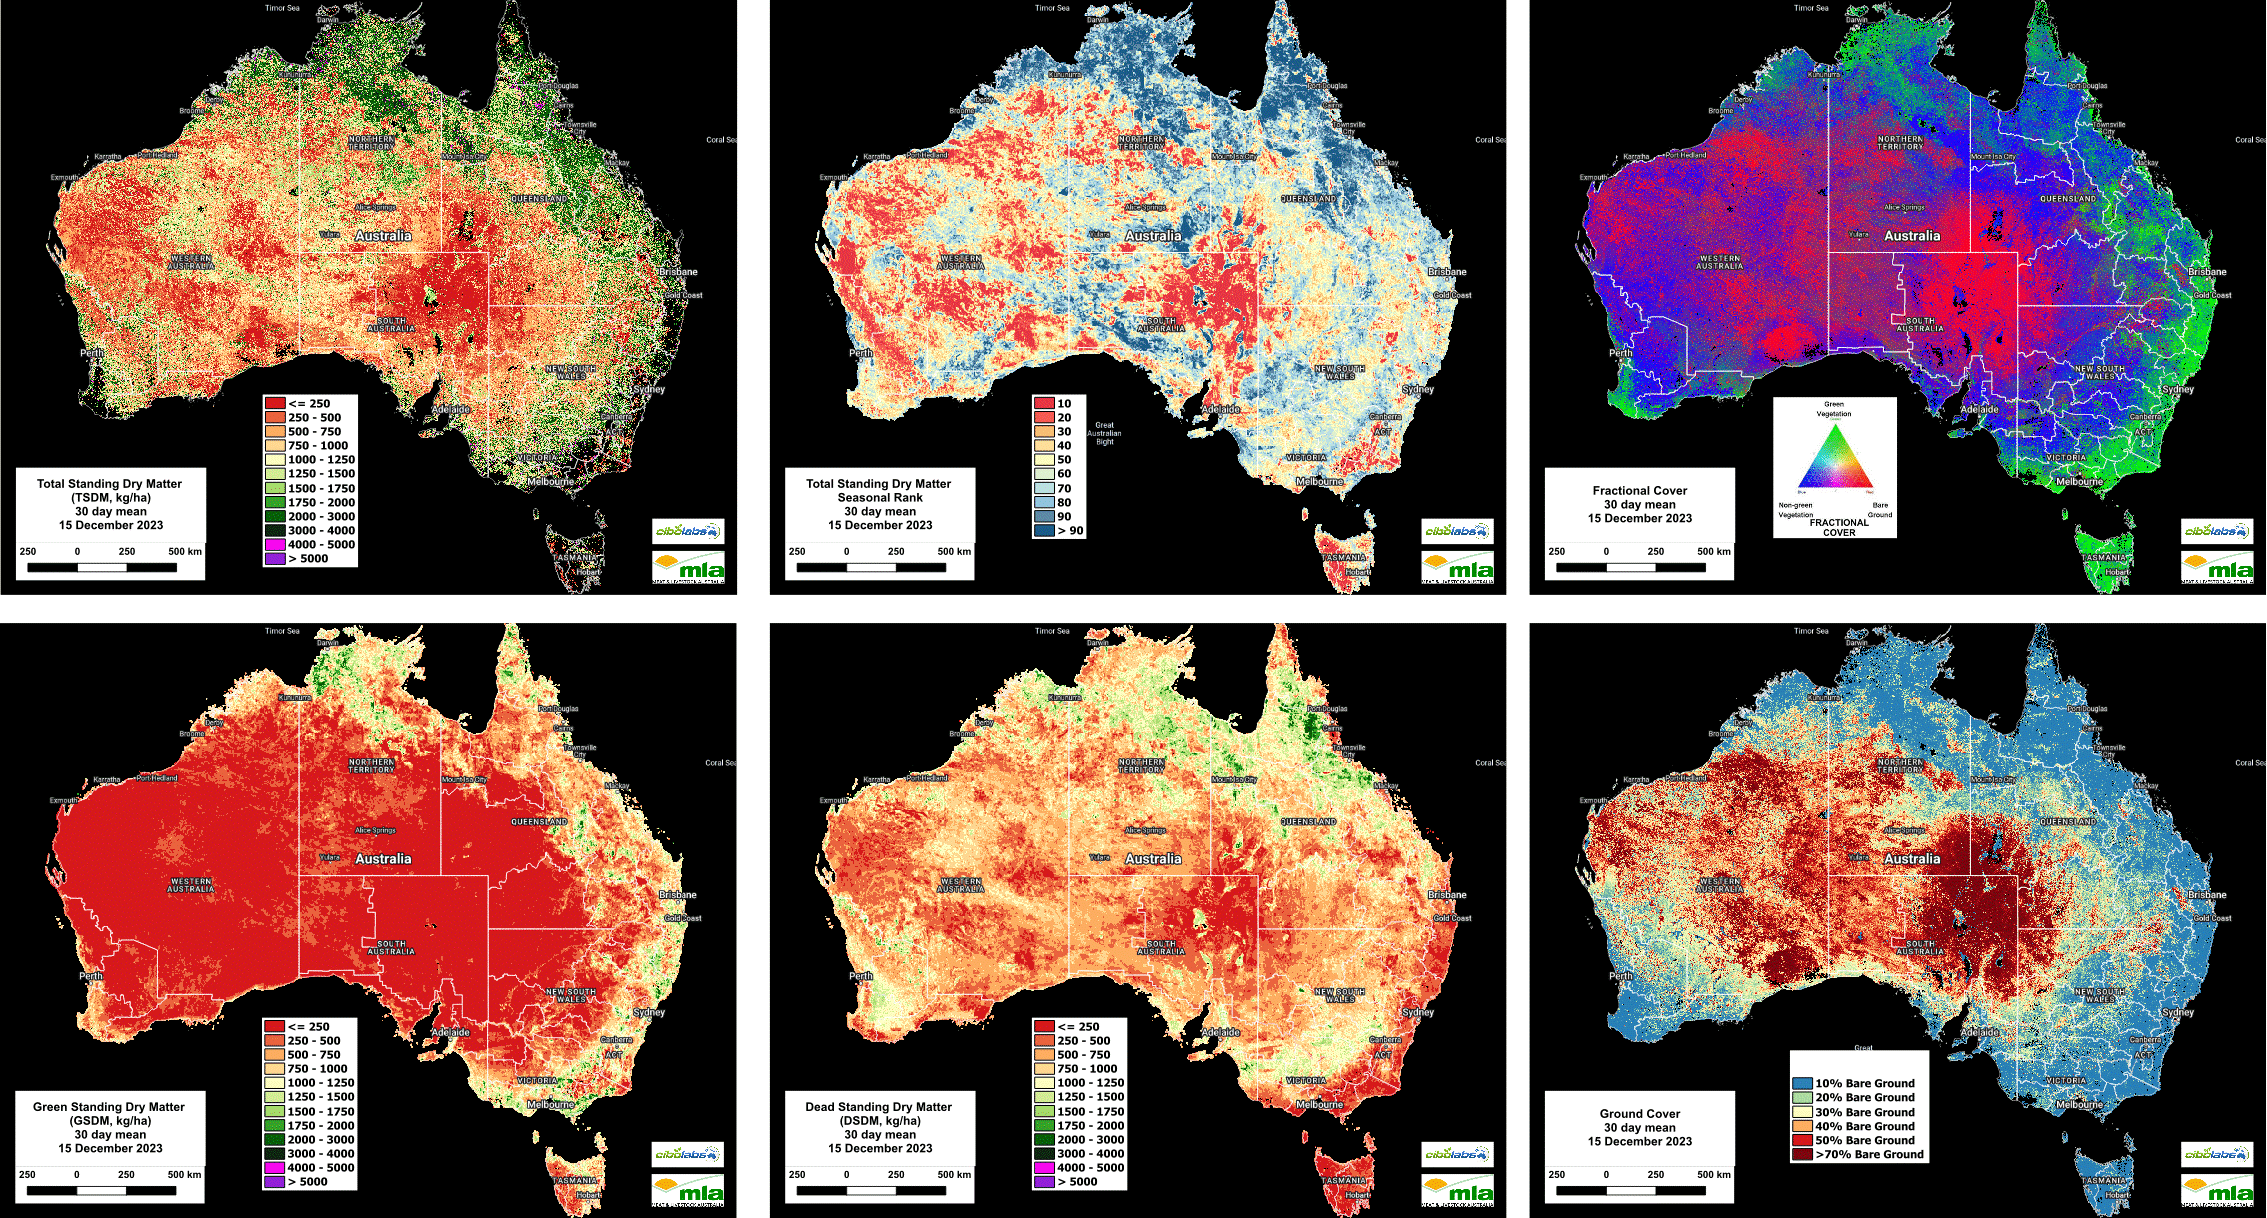
Total Standing Dry Matter
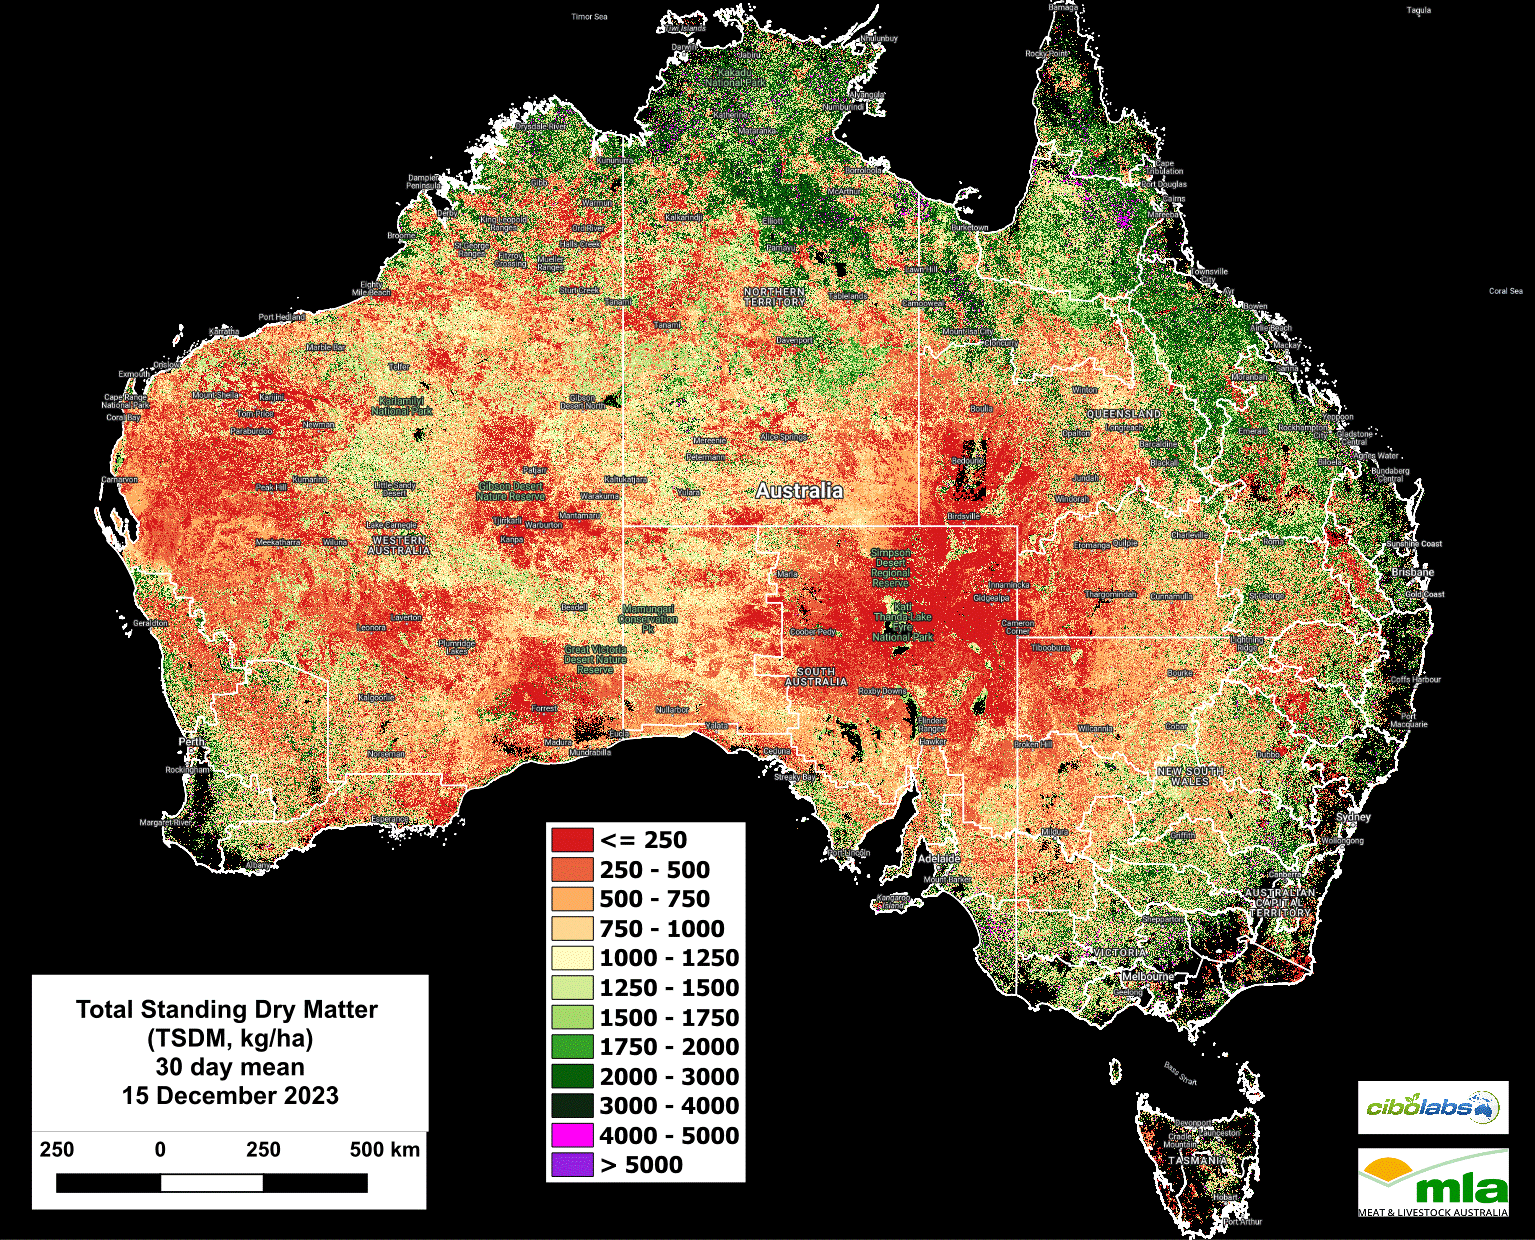
Image 1 – Total Standing Dry Matter (Kg/Ha)
Reflecting the areas of growth identified through the Fractional Cover image presented on December 6, Total Standing Dry Matter levels have now passed through the benchmarks of 1,000kg DM/Ha in the Northern Slopes and Northern Tablelands of NSW and further south into the Central West Tablelands and Southwest Slopes.
Imagery and analysis provided by CiboLabs
In Queensland, the eastern regions, extending from south of Bundaberg through to Townsville and the southern cape, are exceeding levels of 1700 to 2000kg DM/Ha.
Across the Northern Territory and the Kimberley region of Western Australia, noticeable increases in the Total Standing Dry Matter continue to reflect early wet season events. It is also positive to see some areas of Total Standing Dry Matter accumulation to the south and east of Marble Bar in Western Australia. (Figure 1).
Seasonal Comparison Total Standing Dry Matter
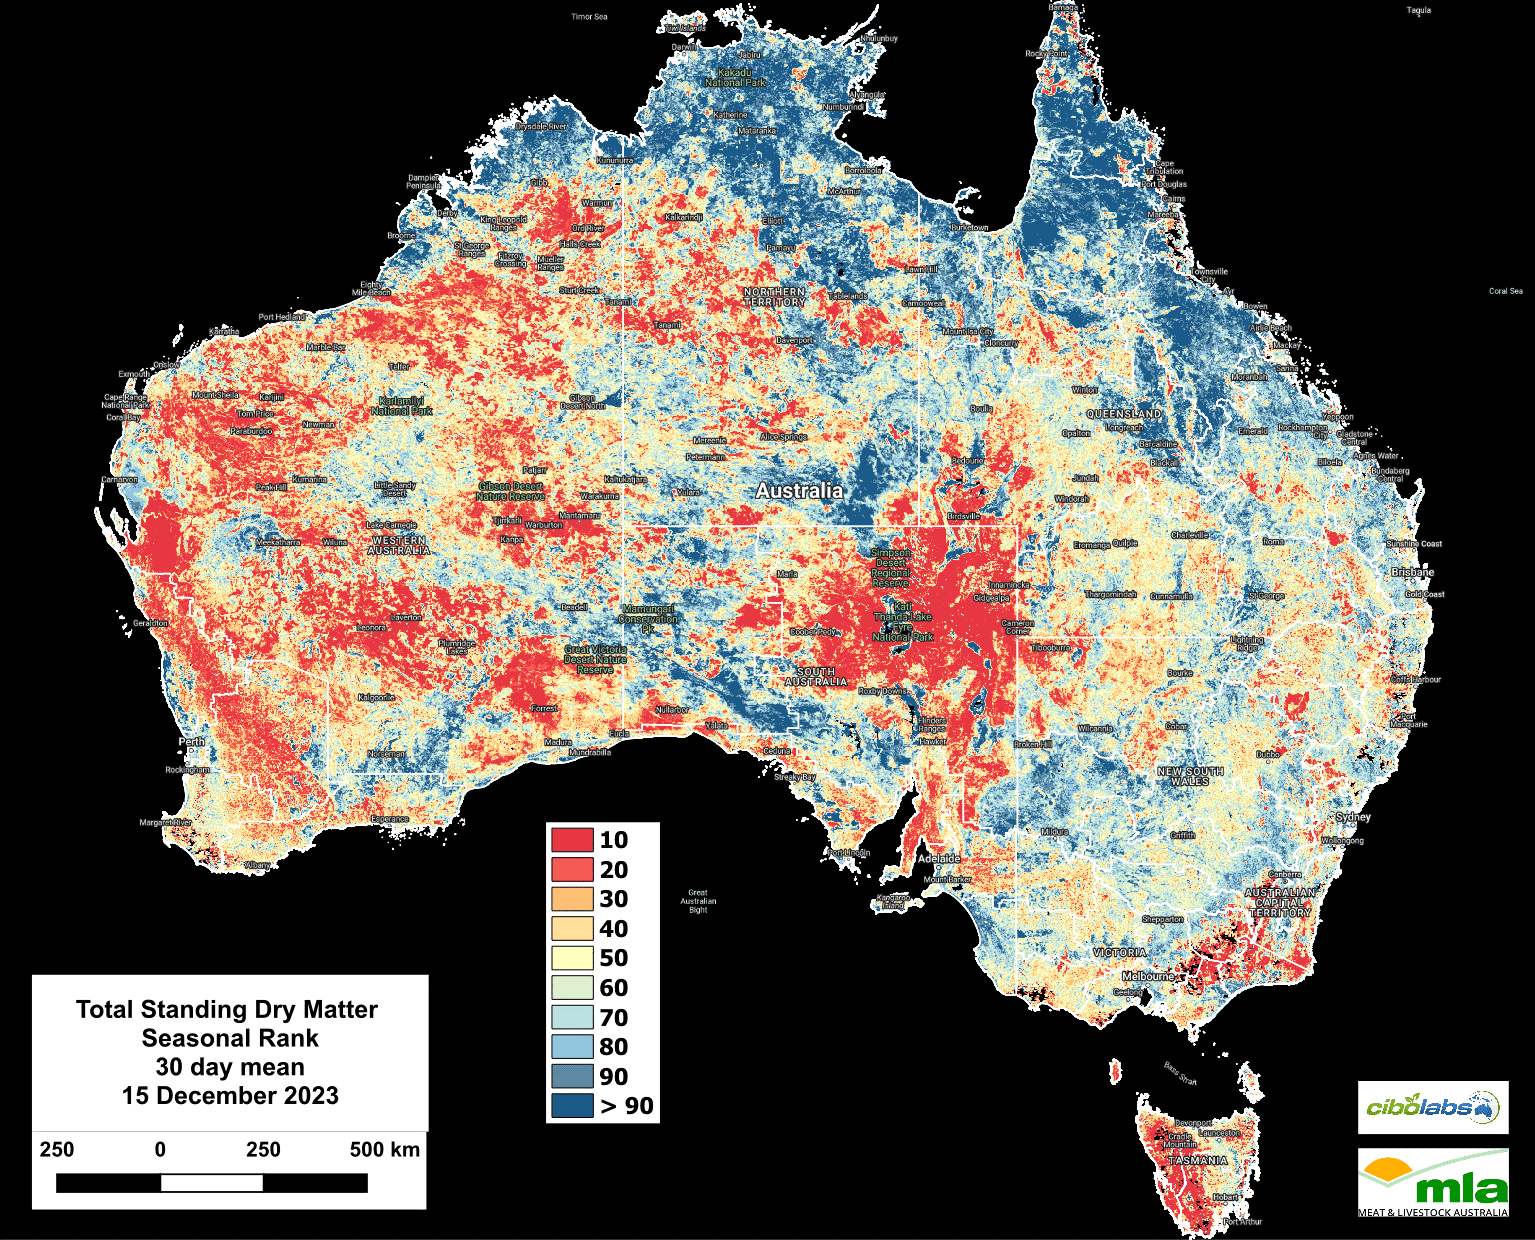
Image 2 – Seasonal Comparison Total Standing Dry Matter
Although growth events and the accumulation of Total Standing Dry Matter has been positive, the actual levels of growth have not yet reached a point to change the seasonal comparisons significantly.
There has been a slight improvement in central NSW, moving from the 50% decile to between 60 & 70% ranges, however areas that have been previously in lower decile ranges for seasonal growth will continue to take some time to recover to average seasonal levels. (Figure 2).
Fractional Cover (Growth)
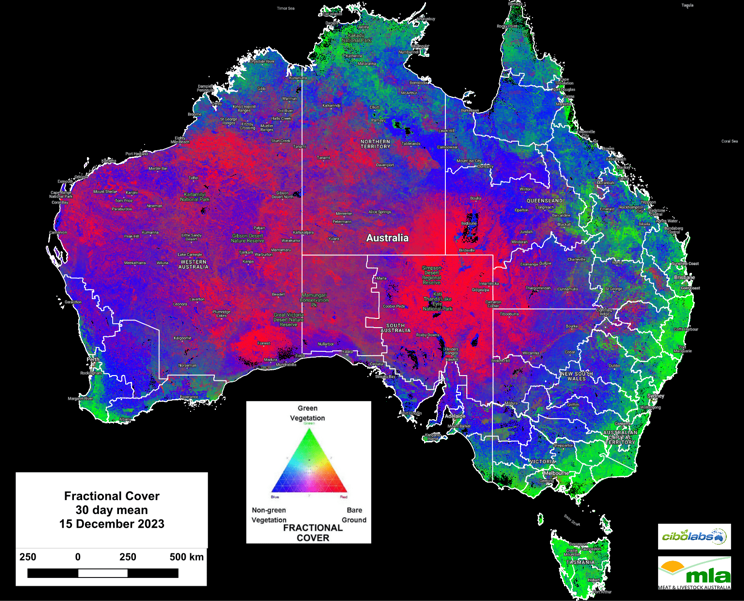
Image 3 – Fractional Cover
Most noticeable in the current images is the extent of actively growing biomass in eastern Australia, most particularly in Northern NSW and Central Queensland. (Image 3).
The path of storm events, and rainfall bands in Queensland has seen a strong band of active growth extending north of Roma to west of Moranbah.
Recent storm events east of Longreach and Barcaldine have also resulted in noticeable growth events.
Eastern NSW continues to display active growth from the northern rivers through to the far south coast, with this growth extending into Gippsland and southwestern coastal areas of Victoria.
Green Total Standing Dry Matter
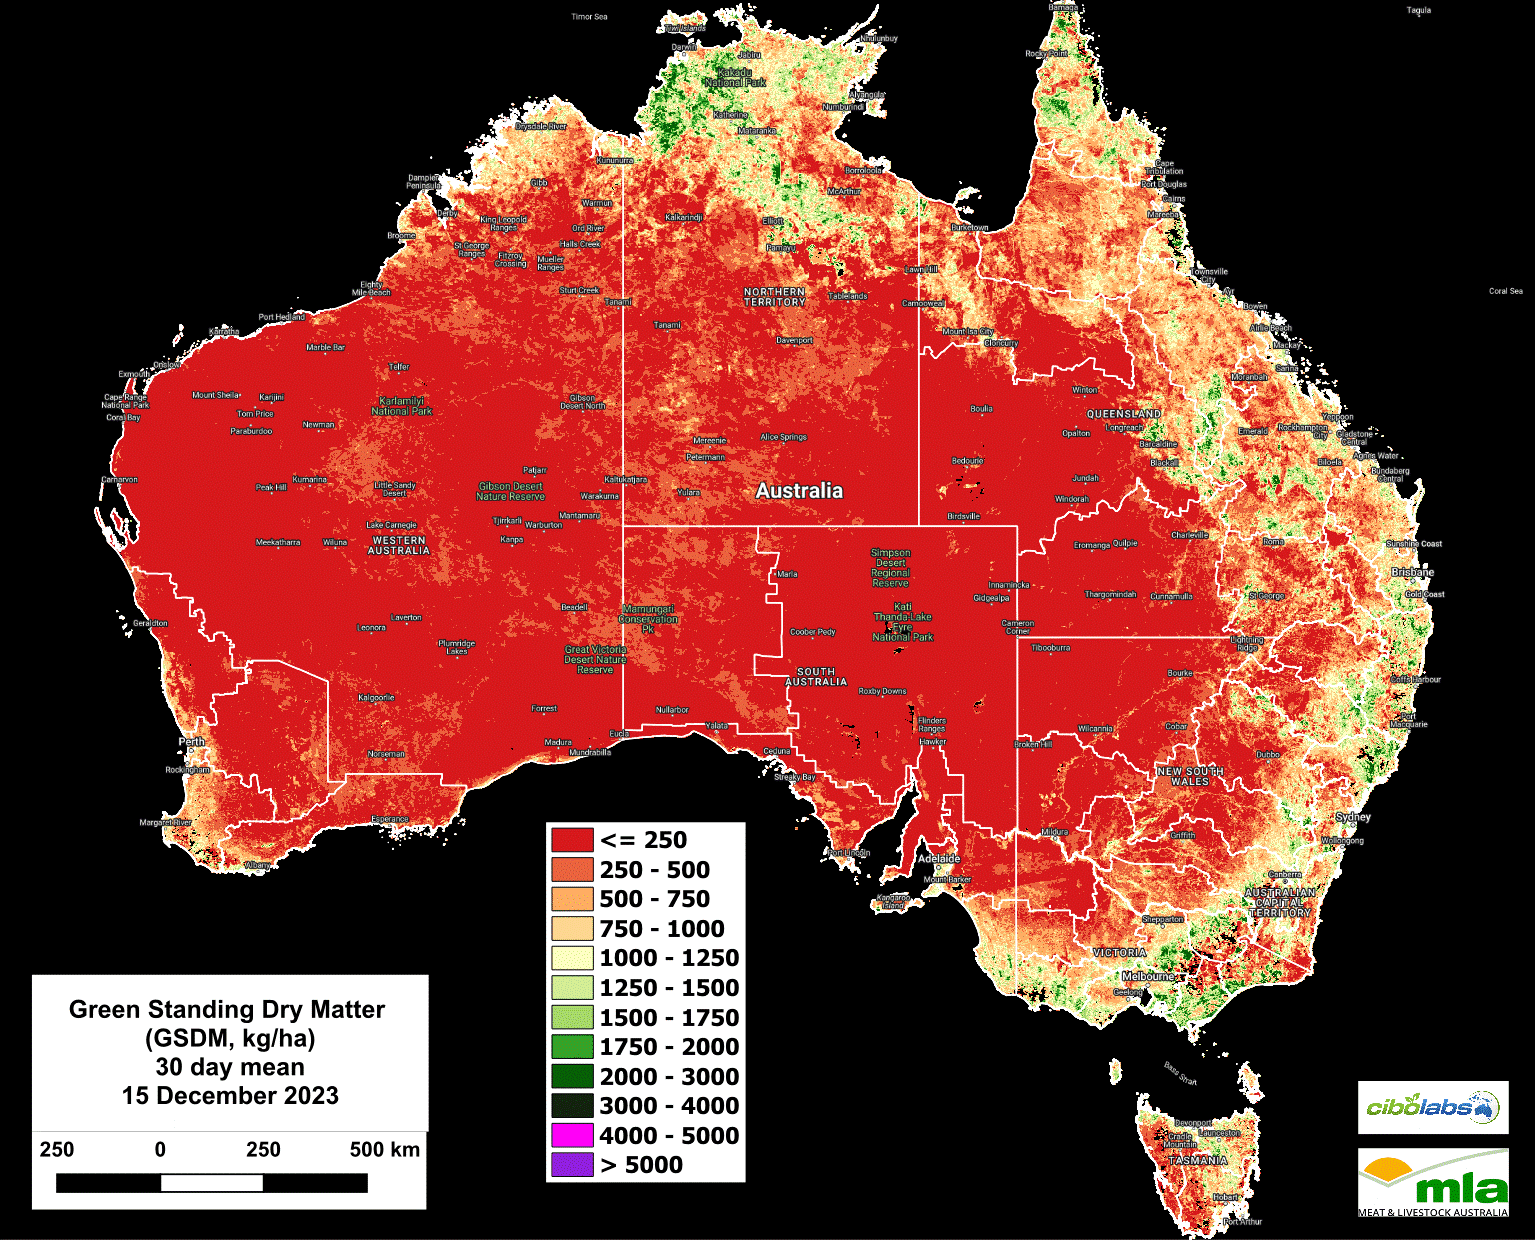
Image 4 – Green Standing Dry Matter
Green Standing Dry Matter levels have increased within the regions already described.
Most noticeable is the rapid increase in Green Standing Dry Matter in Central Queensland, with a change from levels at around 750kg /DM / Ha to over 1750kg/ DM / Ha.
While this is not the case for the entirety of Queensland, the central regions have recorded significant changes in Green Dry Standing Matter.
A similar result has also been recorded in the Northern Territory with a band of growth extending from south of Darwin through to the Barkly Tablelands. (Image 4).
Dead Standing Dry Matter
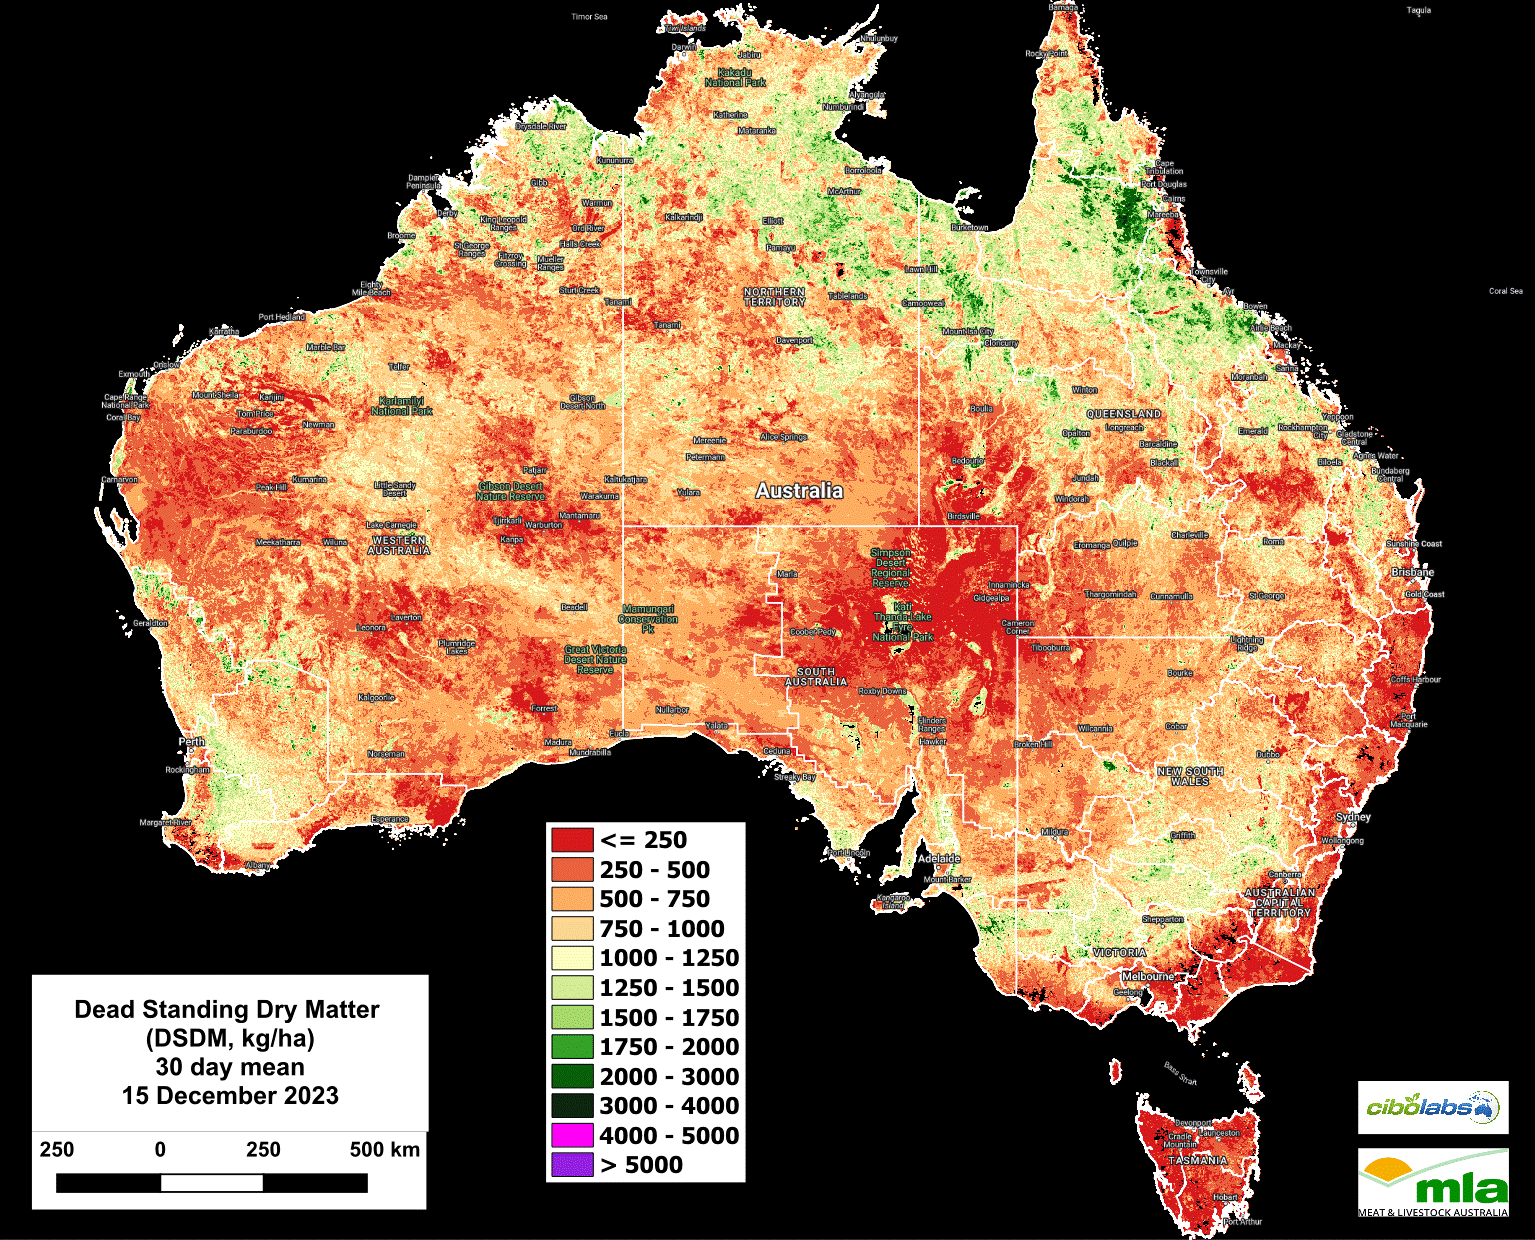
Image 5 – Dead Standing Dry Matter
By comparison with the update of 6 December 2023, levels of Dead Standing Dry Matter have declined in most states.
Contributing to this decline has been the impact of rainfall and storms which has led to detachment and loss of dead material (Image 5).
Monthly Ground Cover levels
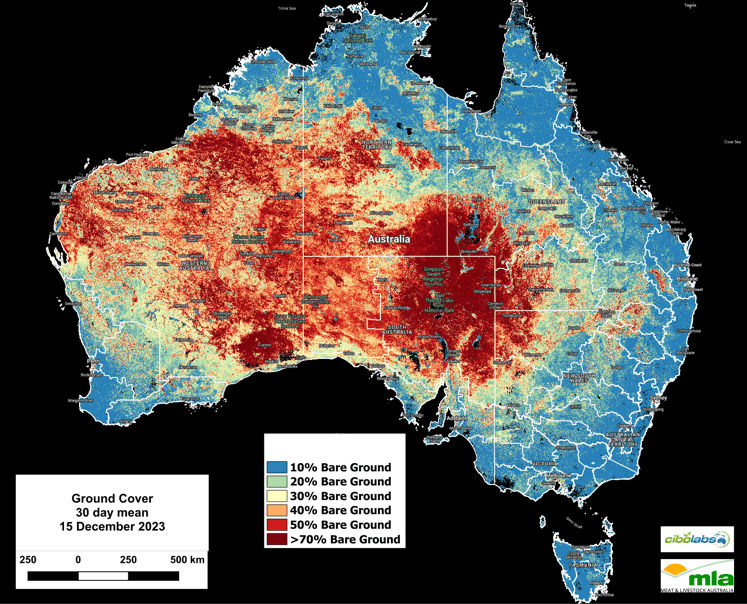
Image 6 – Ground Cover
The downward trend in National Ground Cover levels (30-day rolling average – Image 6) noted in the eastern Kimberley, Gascoyne and Pilbara regions has eased to some degree.
Growth events in these regions have contributed to a stabilisation and slight increase in ground cover levels in these regions.
A similar easing has occurred in the western regions of the Northern Territory, and in the northern regions of South Australia as well as in western NSW and Queensland.
For more localised information including regional level overviews, users are encouraged to explore the Cibo Labs Regional Comparison. This tool provides regional data that may show the impact of localised weather or fire events. A further level of detail for individual properties is available for users who have created an Australian Feedbase Monitor account, which can be accessed both through the MyMLA portal or through the Cibo Labs website.
The Cibo Labs team would like to wish all our clients and readers a happy and safe Christmas. We also want to thank the Beef Central Team, for their support this year, and we look forward to providing updates throughout 2024.
The Cibo Labs National Comparison can be used to freely access these layers (https://www.cibolabs.com.au/products/national-comparsion/) to view the most recent images from a national, state or catchment level.
This tool can complement the Australian Feedbase Monitor which can also be created within the Cibo Labs Web Site www.cibolabs.com.au