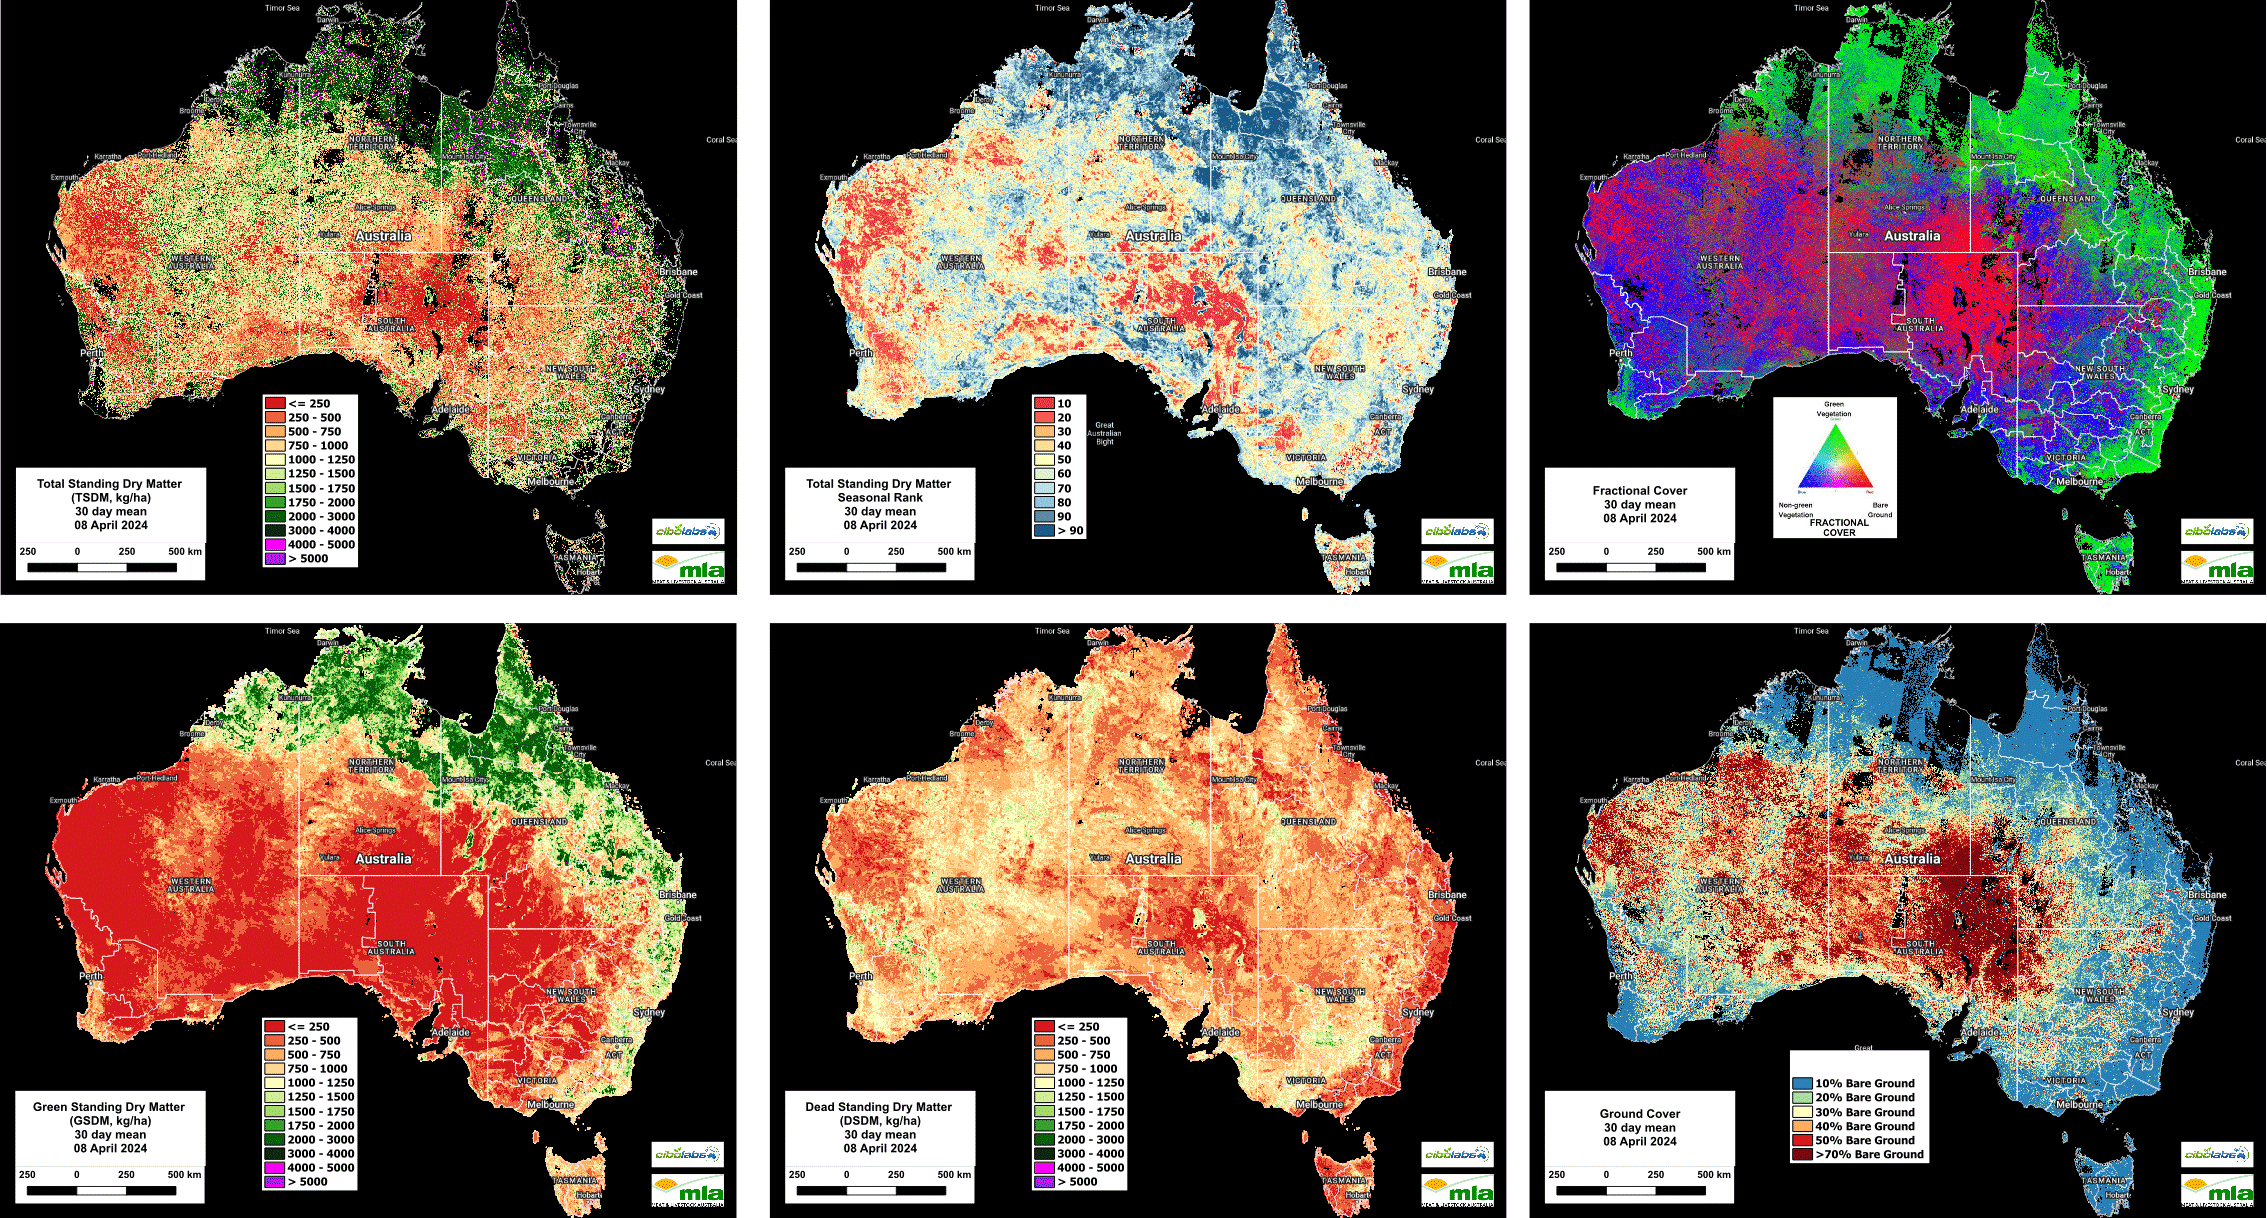
NATIONAL biomass levels continue to be dominated by the high levels of growth in northern Australia.
A significant portion of the Northern Territory, Queensland Gulf regions and eastern Kimberley region have areas with Total Standing Dry Matter exceeding 5,000kg/Ha.
Across eastern Australia, there has been a slight improvement in TSDM levels, with improvements visible throughout eastern Qld, NSW, Victoria, and Tasmania.
However, Western Australia still has large areas with low levels of TSDM.
Imagery and analysis provided by CiboLabs
Total Standing Dry Matter
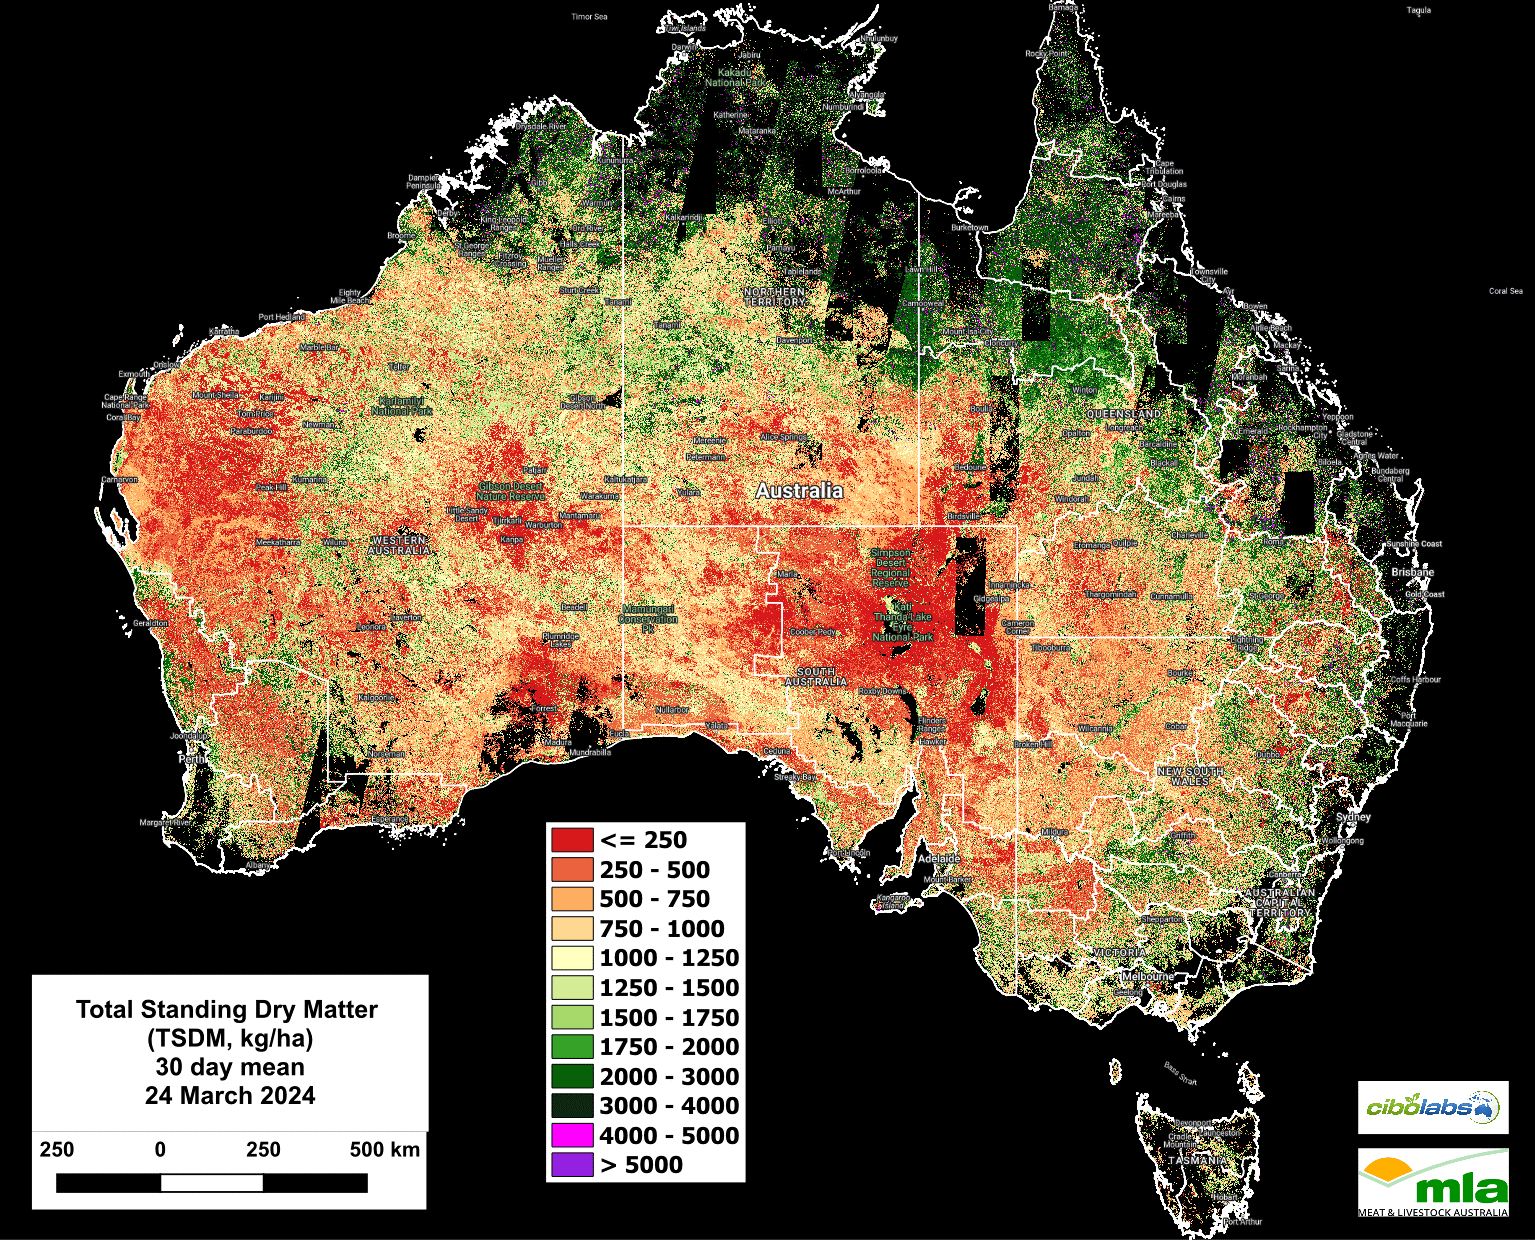
Image 1 – Total Standing Dry Matter (Kg/Ha)
Looking more closely at the most recent TSDM image from 8th of April, it is possible to see some slight increases in TSDM for parts of the northern Pilbara as well as southwest Western Australia.
However, these changes are only slight and much of that state continues to have low TSDM levels in all major agricultural and grazing regions.
Seasonal Comparison Total Standing Dry Matter
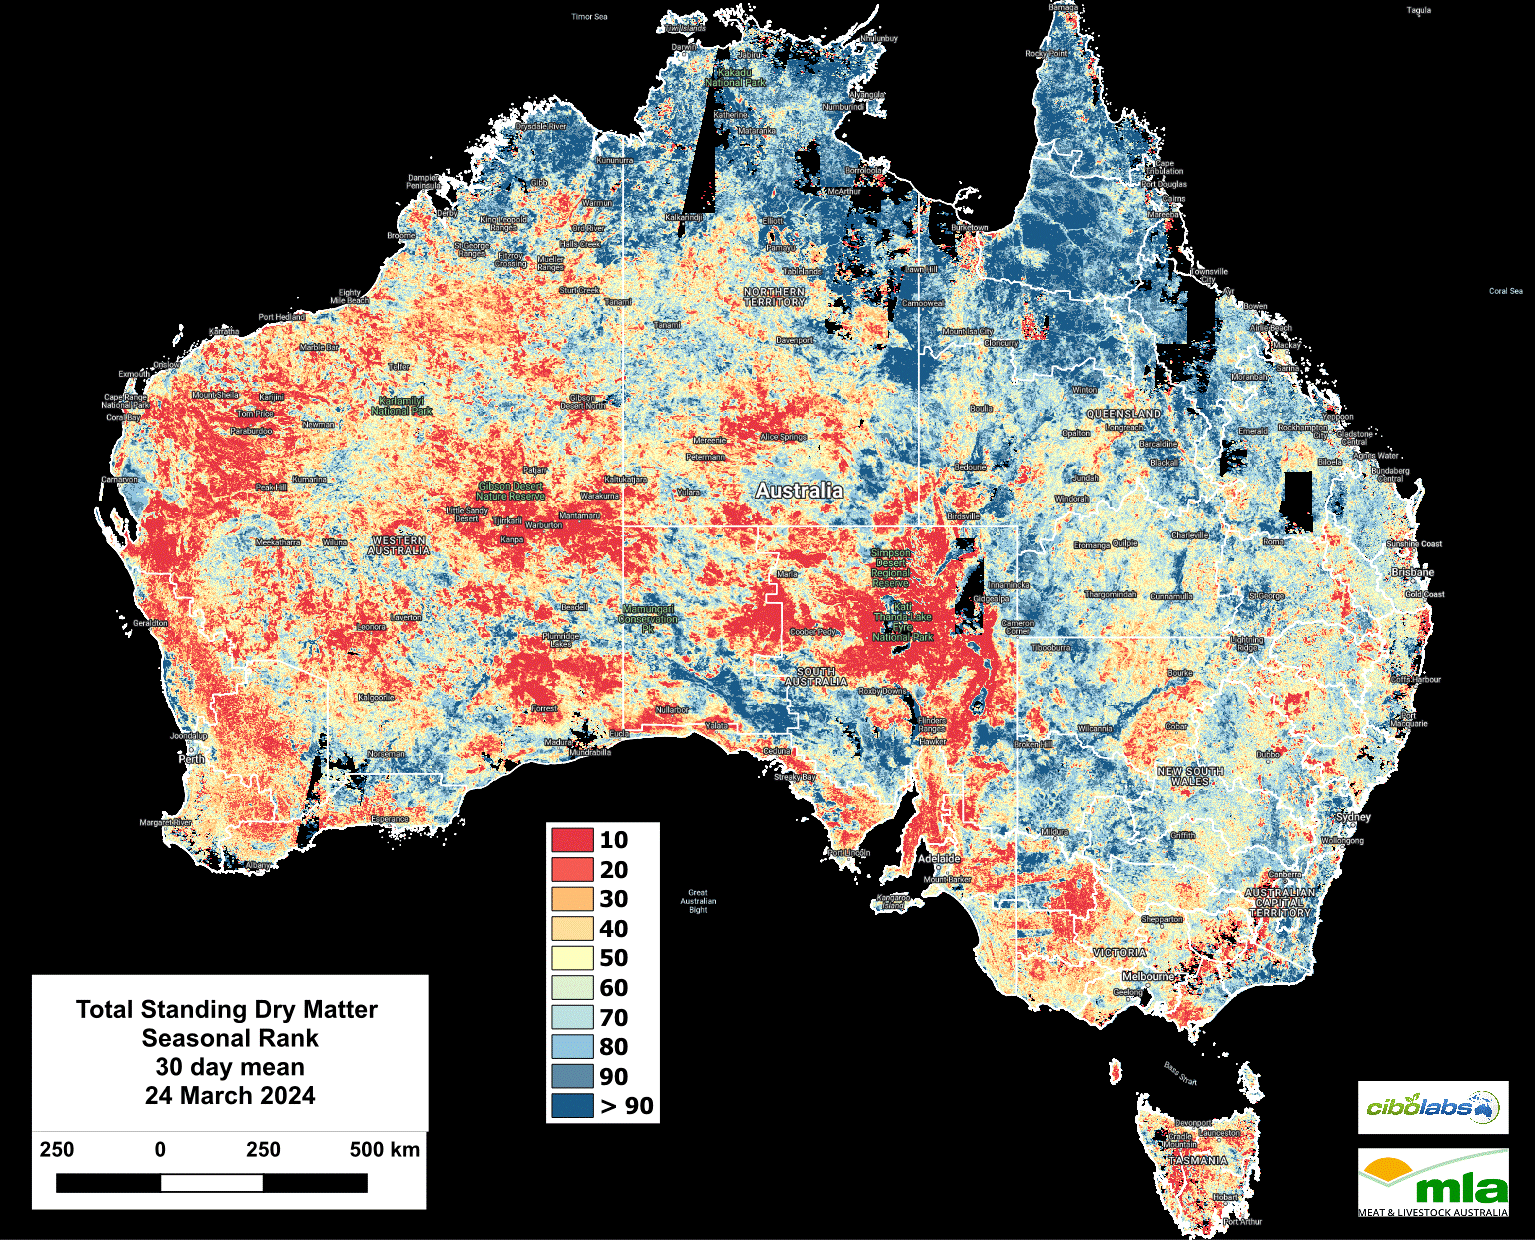
Image 2 – Seasonal Comparison Total Standing Dry Matter
Considering the 8-year average (Figure 2) these regions of Western Australia, including the southwest, Gascoyne and Pilbara all remain in the lower 20% decile.
The same image indicates a range of seasonal conditions impacting South Australia.
The northern pastoral zones continue to be well below the 8-year average, as does the southeast, however there are notable areas in the central portion of the state that are reflecting a better than average season.
In eastern Australia, Tasmania, Victoria, and NSW have seen some improvements in the seasonal average while much of Queensland remains above the average for this time of the year.
Fractional Cover (Growth)
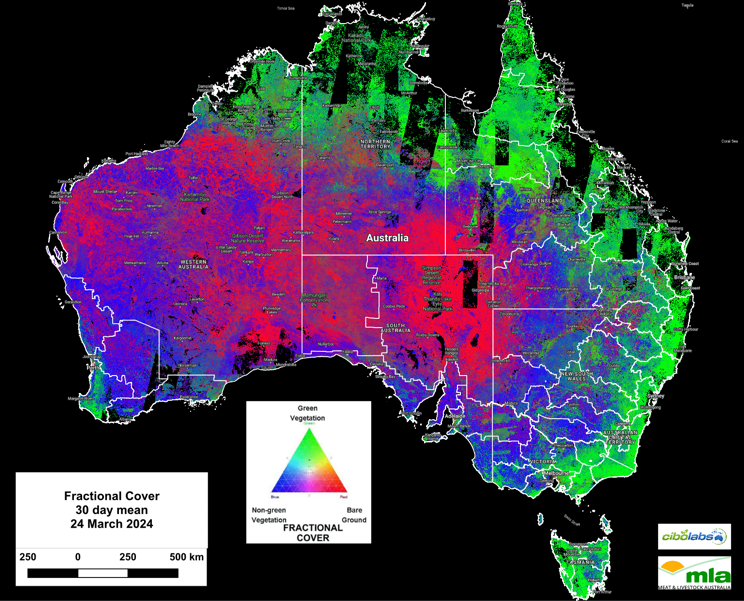
Image 3 – Fractional Cover
Fractional Cover (Image 3) continues to reflect the high level of rainfall and favourable growth conditions across northern Australia and along the eastern seaboard.
Inland areas of growth along the major waterways and areas that have been impacted by floodwater are also notable.
As expected, the western states have only small areas of active growth reflecting coastal rainfall events.
Green Total Standing Dry Matter
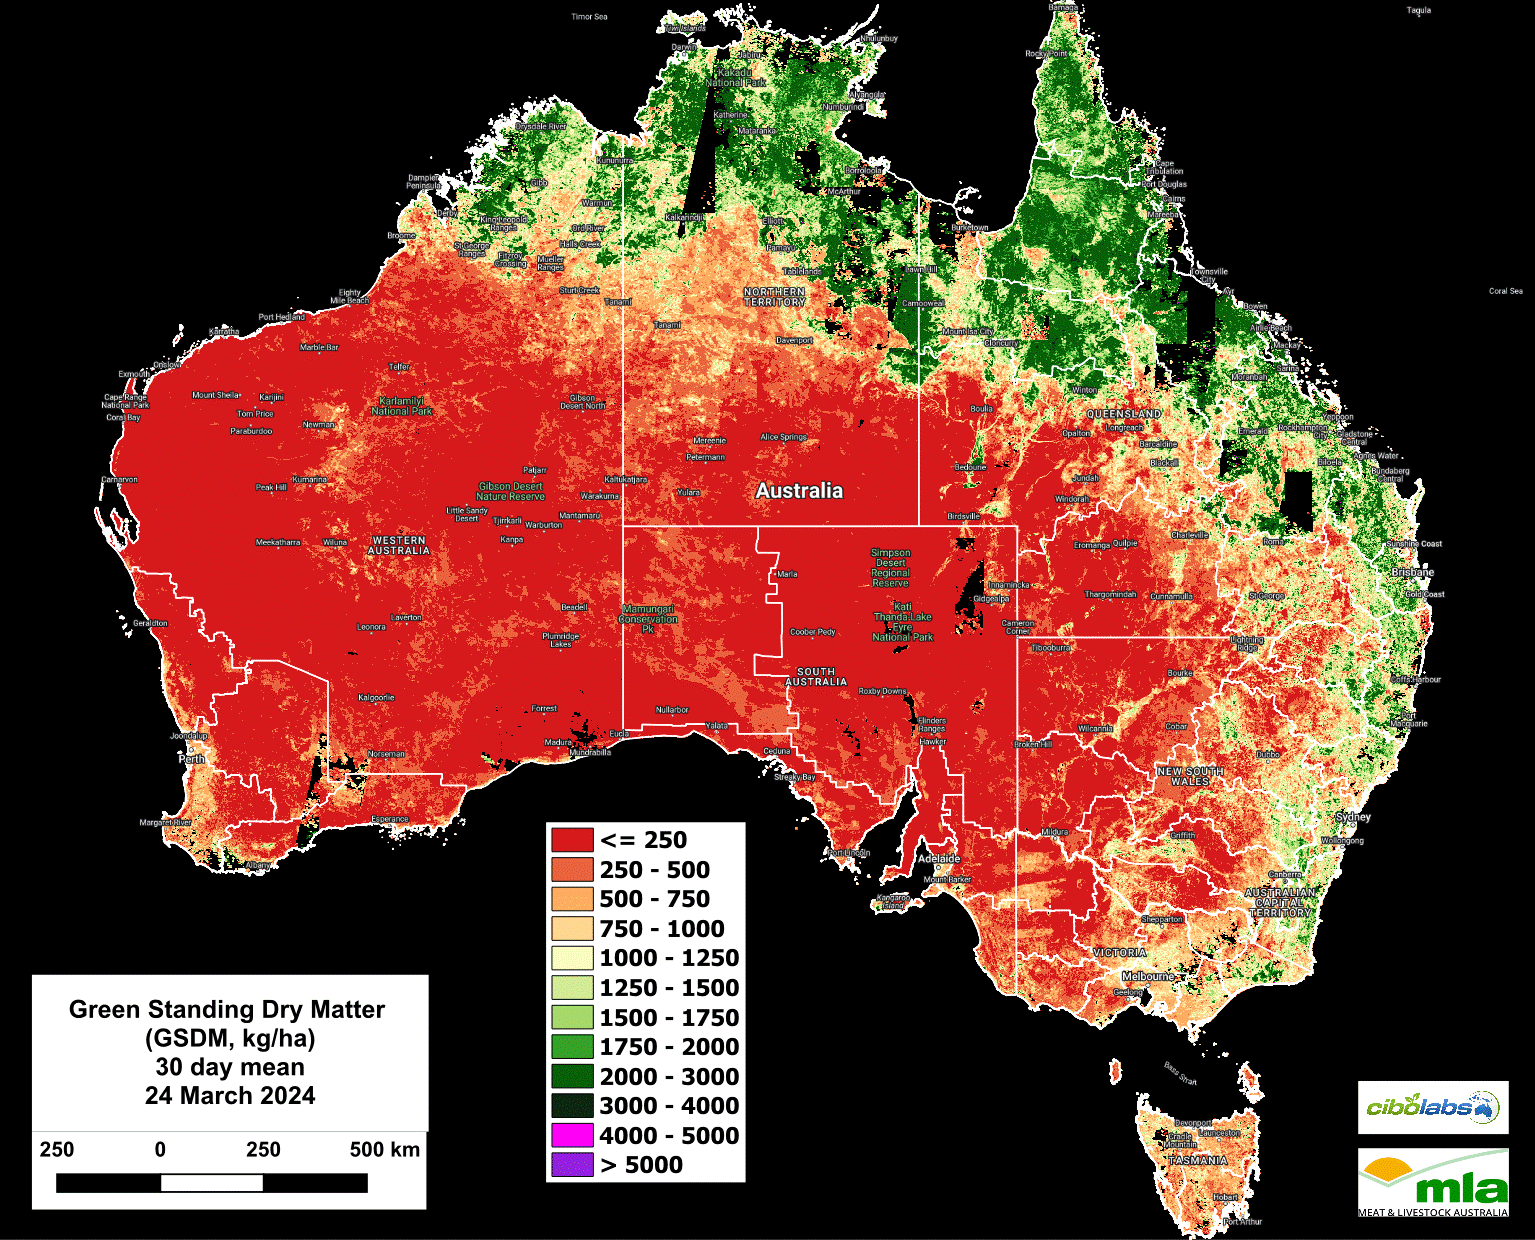
Image 4 – Green Standing Dry Matter
Although Total Standing Dry Matter levels in northern Australia are very high (in excess of 5,000kg/Ha in some regions) the Green Standing Dry Matter images show a gradual reduction across northern Australia.
This suggests much of the pasture mass has now started to mature, and while growth events are still occurring, much of the feed base is dominated by mature and lower quality feed.
The amount of Green Standing Dry Matter in the east is also contracting eastward, reflecting rainfall and soil moisture. (Image 4).
Dead Standing Dry Matter
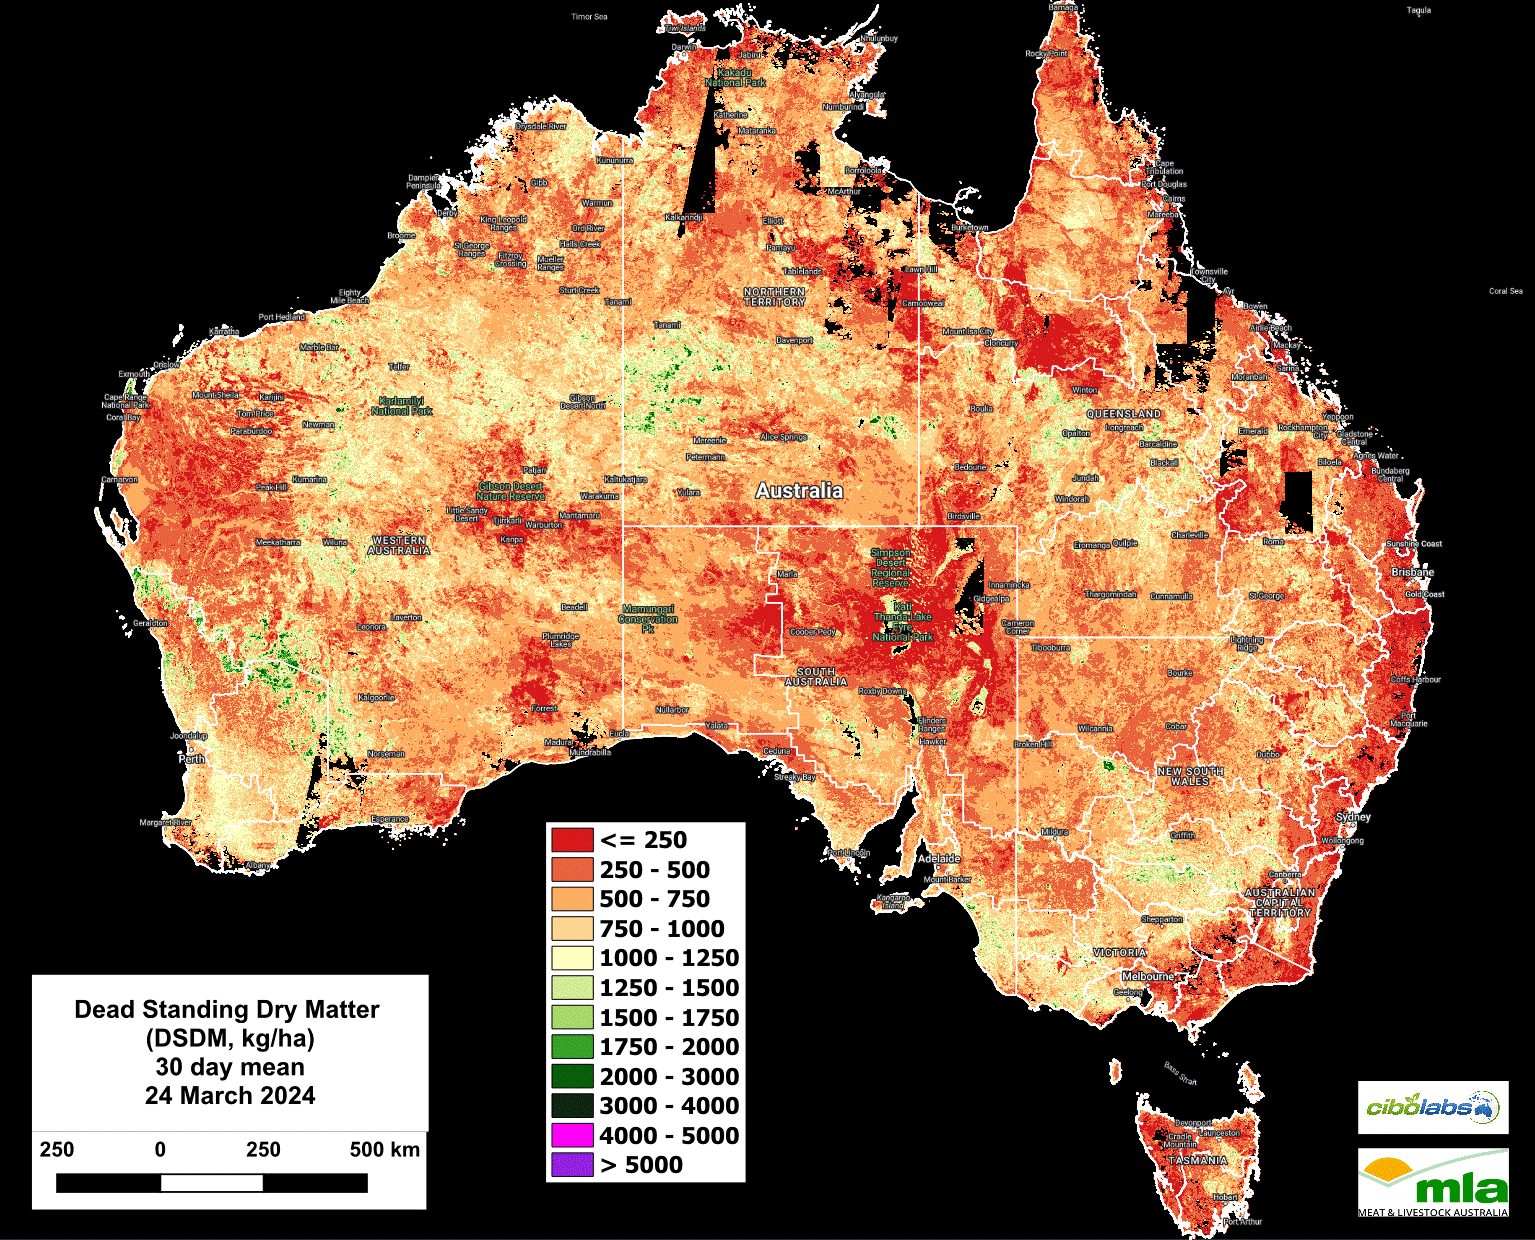
Image 5 – Dead Standing Dry Matter
Dead Standing Dry Matter imagery (Image 5) reflects the growth pattern observed in northern Australia, with increased areas with Dead Standing Dry Matter in the range of 1250 – 1500 Kg/Ha.
The eastern seaboard continues to have low levels of dead material within the feedbase.
The NSW Riverina and northern Victorian Riverland have seen areas of dead material increase slightly as temperatures start to decline with autumn, however, across much of these states, no significant changes have been noted.
Monthly Ground Cover levels
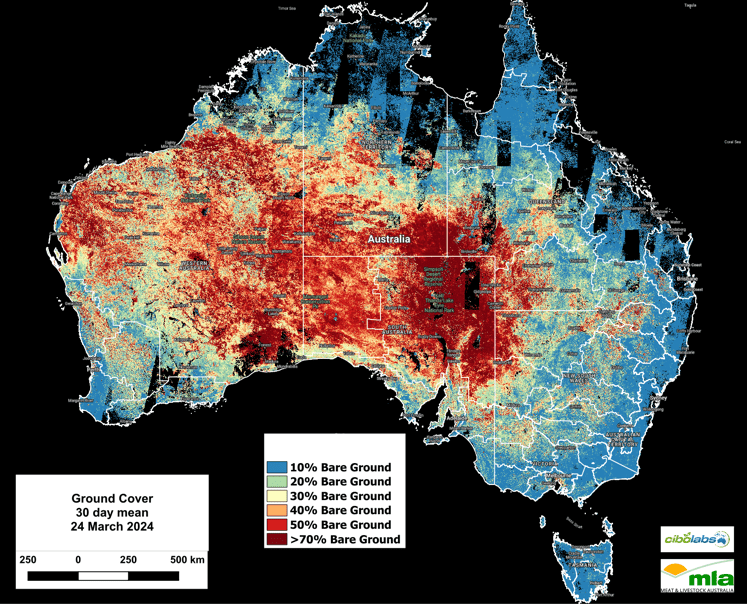
Image 6 – Ground Cover
Ground cover levels remain largely similar to previous observations with no significant alterations noted. (Image 6)
For more localised information including regional level overviews, users are encouraged to explore the Cibo Labs Regional Comparison. This tool provides regional data that may show the impact of localised weather or fire events. A further level of detail for individual properties is available for users who have created an Australian Feedbase Monitor account, which can be accessed both through the MyMLA portal or through the Cibo Labs website.
The Cibo Labs National Comparison can be used to freely access these layers (https://www.cibolabs.com.au/products/national-comparsion/) to view the most recent images from a national, state or catchment level.
This tool can complement the Australian Feedbase Monitor which can also be created within the Cibo Labs Web Site www.cibolabs.com.au