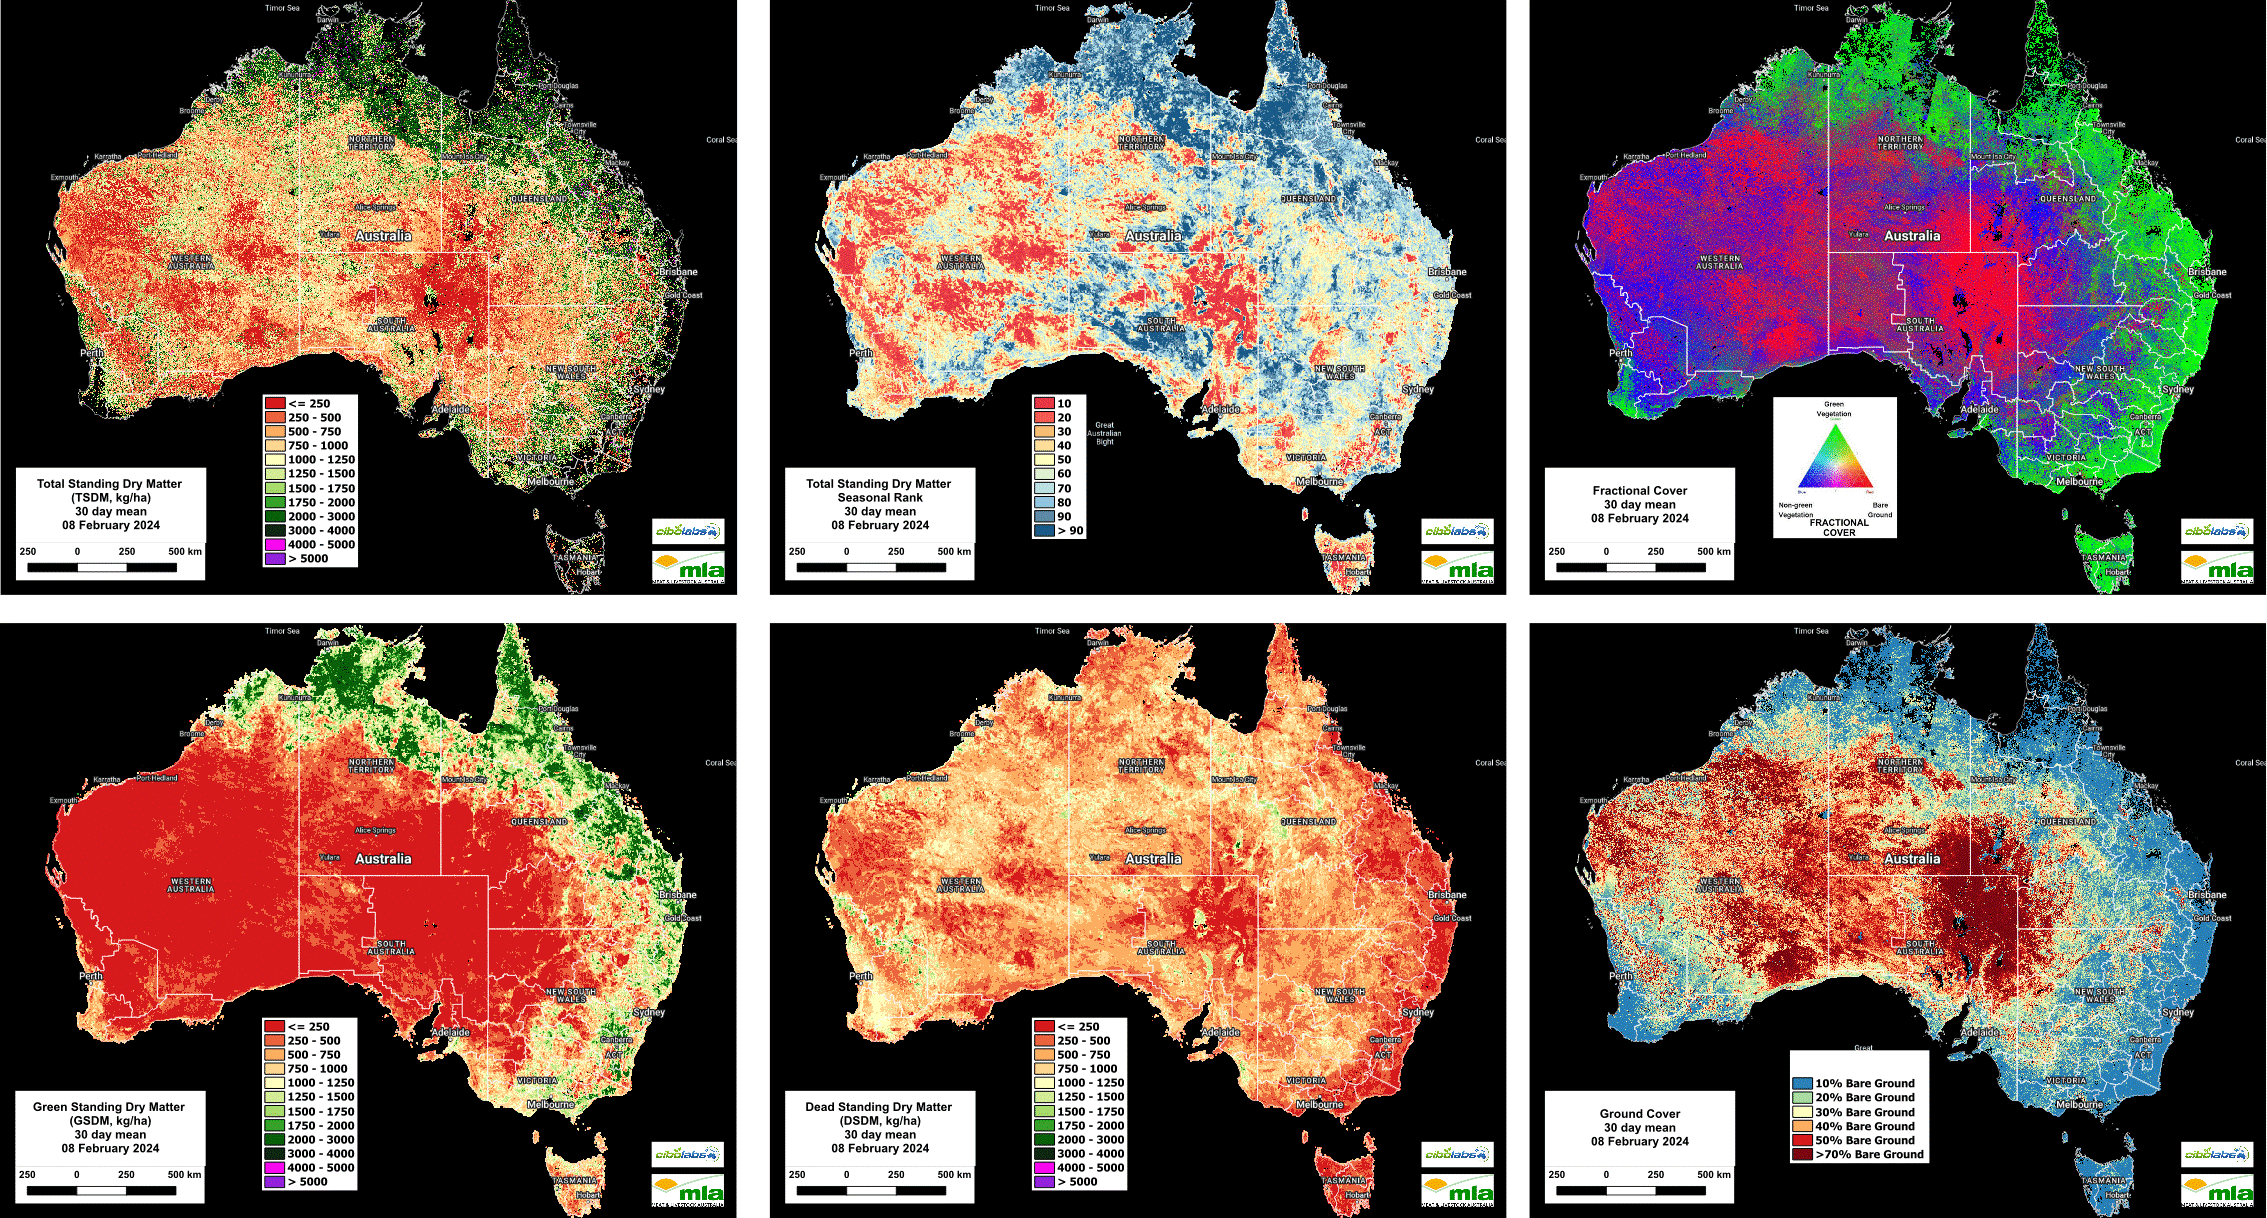
Nationally, biomass levels remain steady or slightly improved as a result of recent weather events, particularly in the northern and eastern parts of the country.
As many graziers & land managers have noted, pasture mass levels in some areas are well above the long-term average, while significant areas of growth in response to rainfall are noted across eastern Australia.
Imagery and analysis provided by CiboLabs
Total Standing Dry Matter
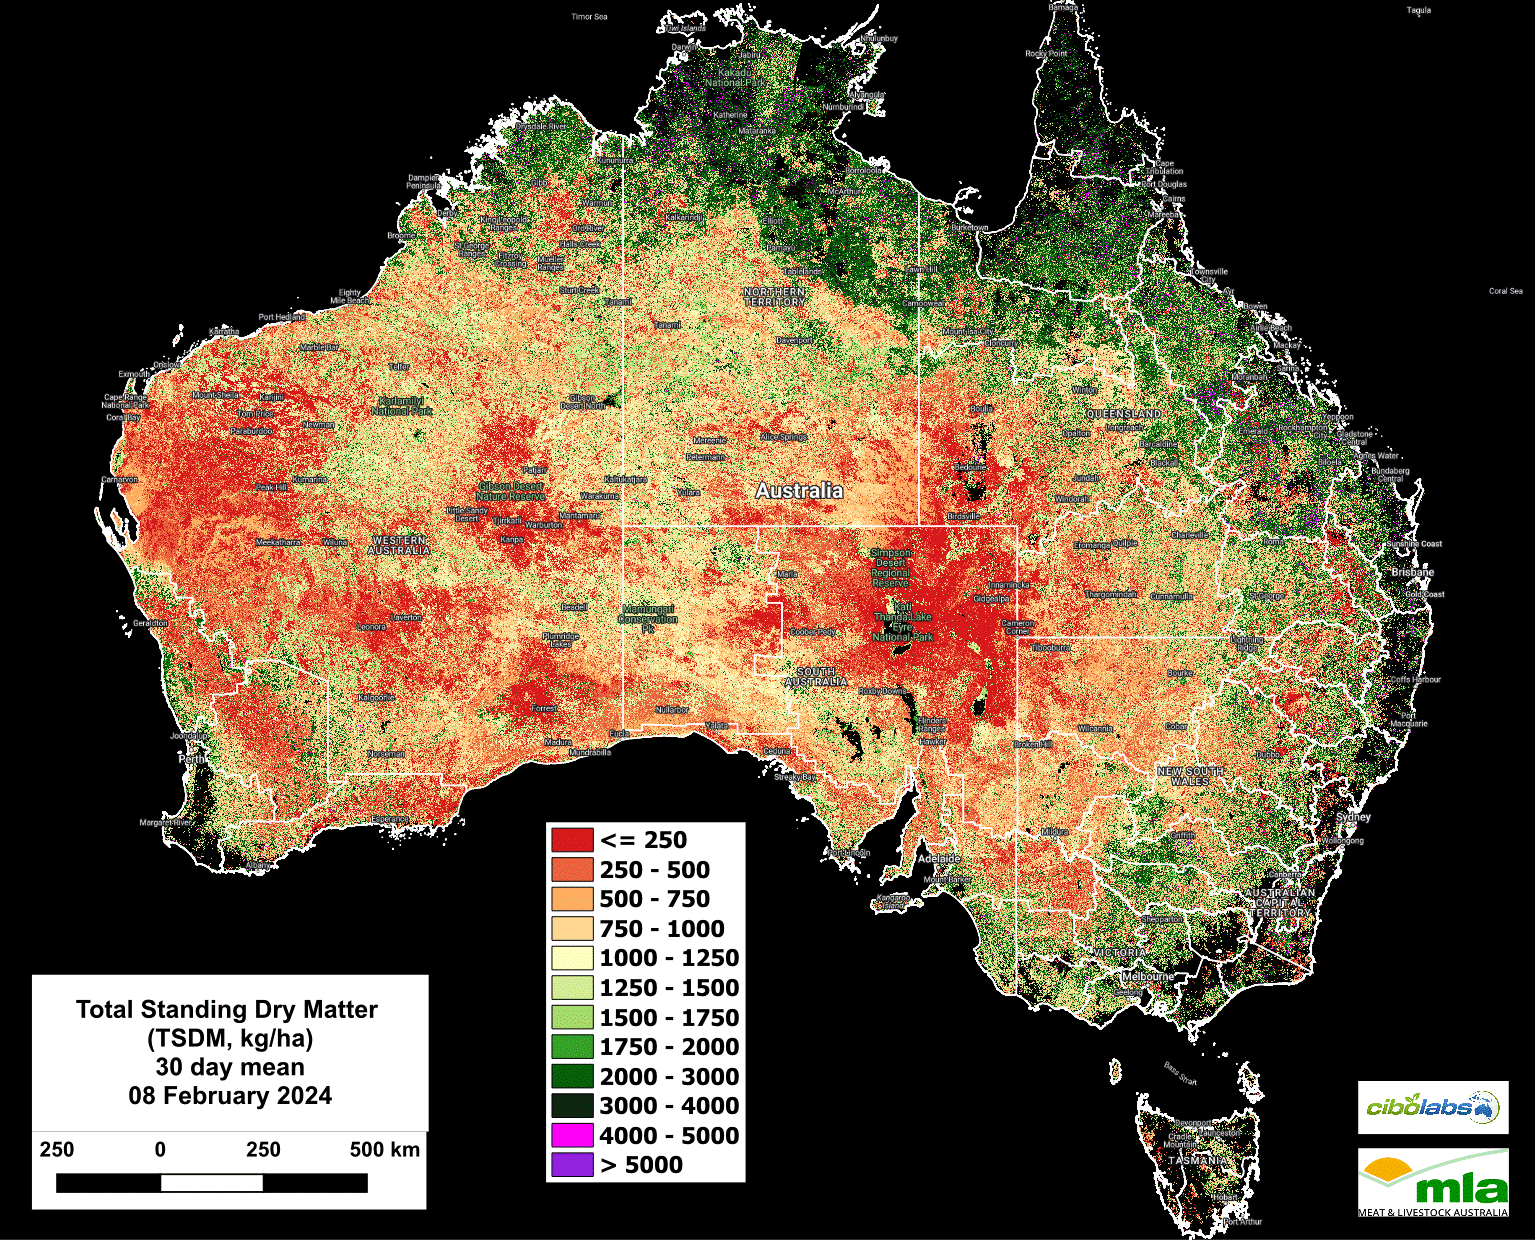
Image 1 – Total Standing Dry Matter (Kg/Ha)
Total Standing Dry Matter, measured in Kg/Ha have increased in all states.
 In comparison to updates at the end of January 2024, the national TSDM image shows a reduction in areas with less than 500kg DM/Ha.
This is evidenced in the reduction of red shading (indicating less than 500kg DM/Ha) and increased areas of amber and yellow shades.
This is particularly notable in Western Australia, the Northern Territory and Tasmania.
Seasonal Comparison Total Standing Dry Matter
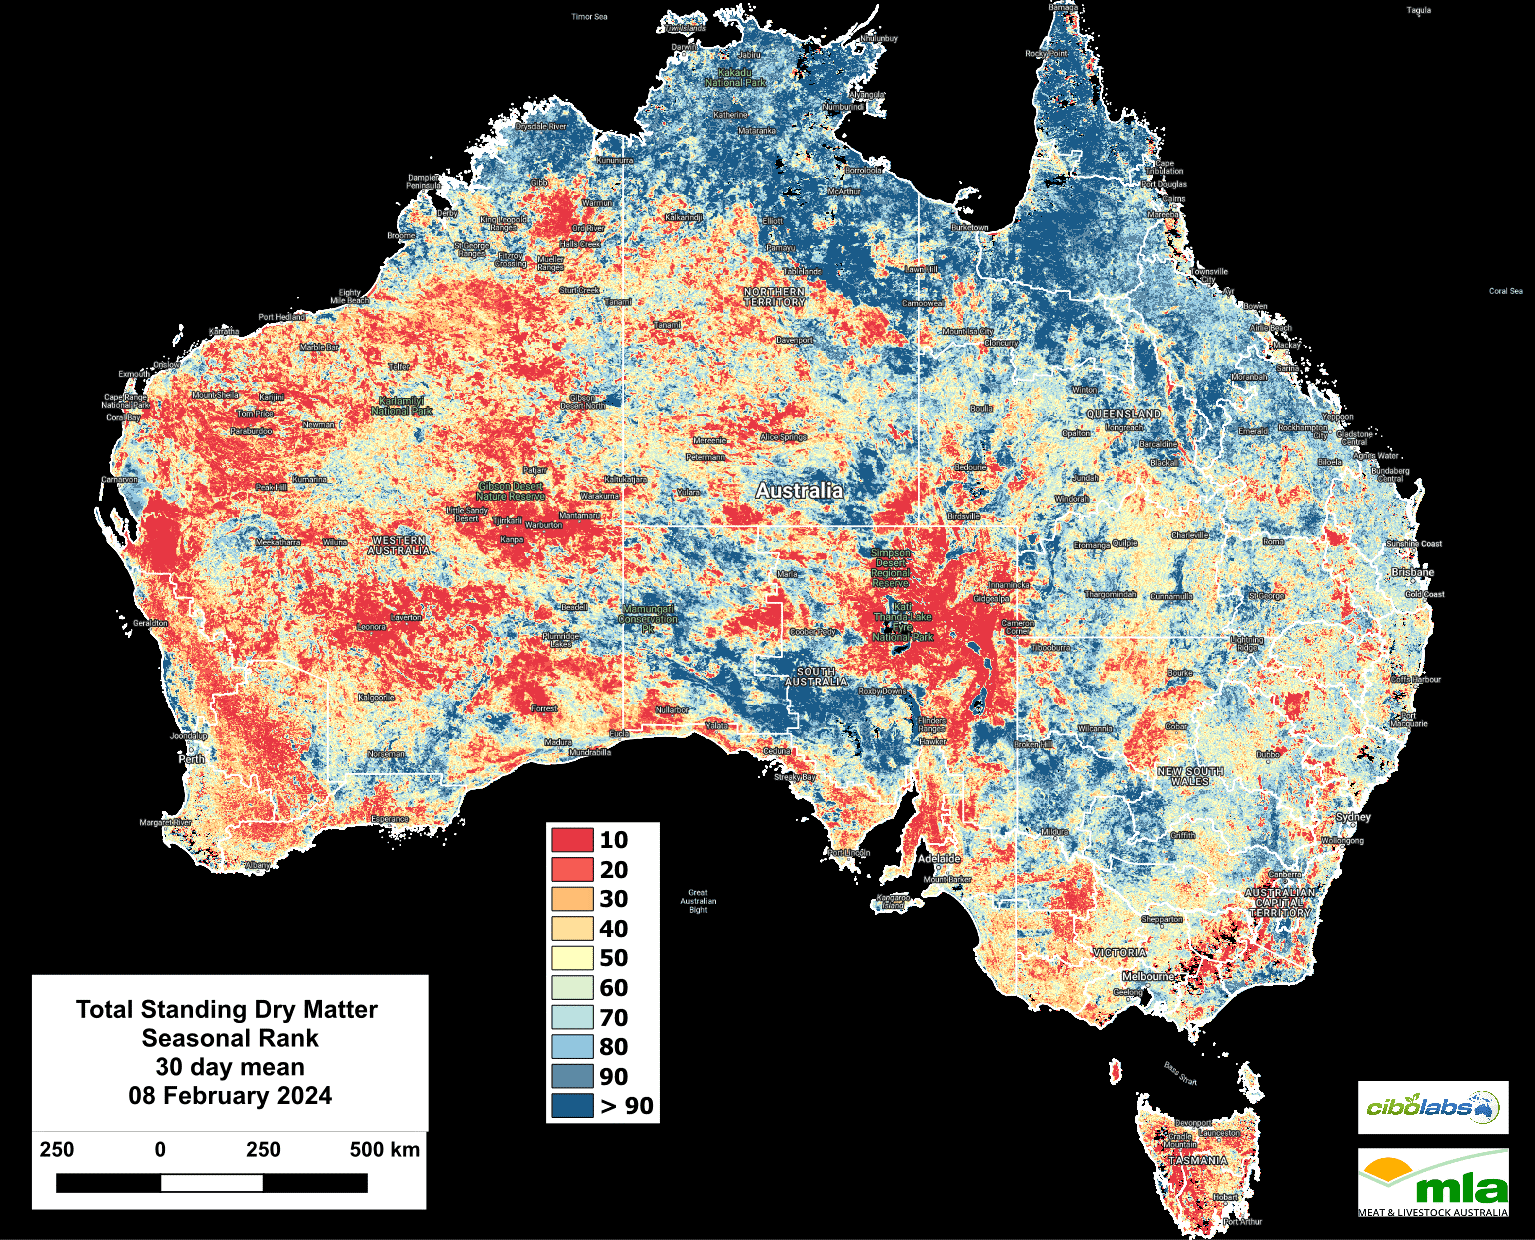
Image 2 – Seasonal Comparison Total Standing Dry Matter
The seasonal ranking image which ranks current conditions against the average of the past eight years, has remained largely unchanged from the previous update.
Areas that are well below the long-term seasonal average include the southwest of Western Australia, Pilbara and Gascoyne and southwest Tasmania.
There are also fairly large areas in Victoria’s southwest, South Australia and southwest Queensland that are below the long-term averages for this time of the year. (Figure 2).
Fractional Cover (Growth)
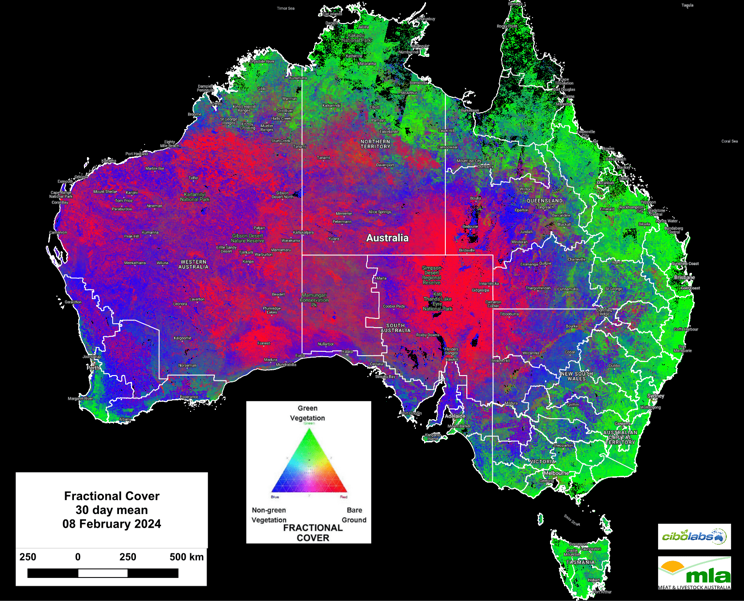
Image 3 – Fractional Cover
The widespread rainfall associated with ex Tropical cyclone Kirrily has significantly contributed to an expansion in areas experiencing new biomass growth.
The Fractional Cover image (Image 3) indicates new growth throughout the Gulf country of Northwest Queensland, through to areas east of Mount Isa and then south towards Charleville and St George.
In the Northern Territory, the northern Barkly, from Camooweal on the Queensland border, west across to Elliott and Kalkarindji are experiencing conditions that allow significant growth to occur.
In the southern states, growth remains a feature along the coastal areas, and west to Dubbo in NSW.
Some recent rainfall events around Bourke have also supported growth events. Much of eastern & southern Victoria are also experiencing good levels of growth.
Green Total Standing Dry Matter
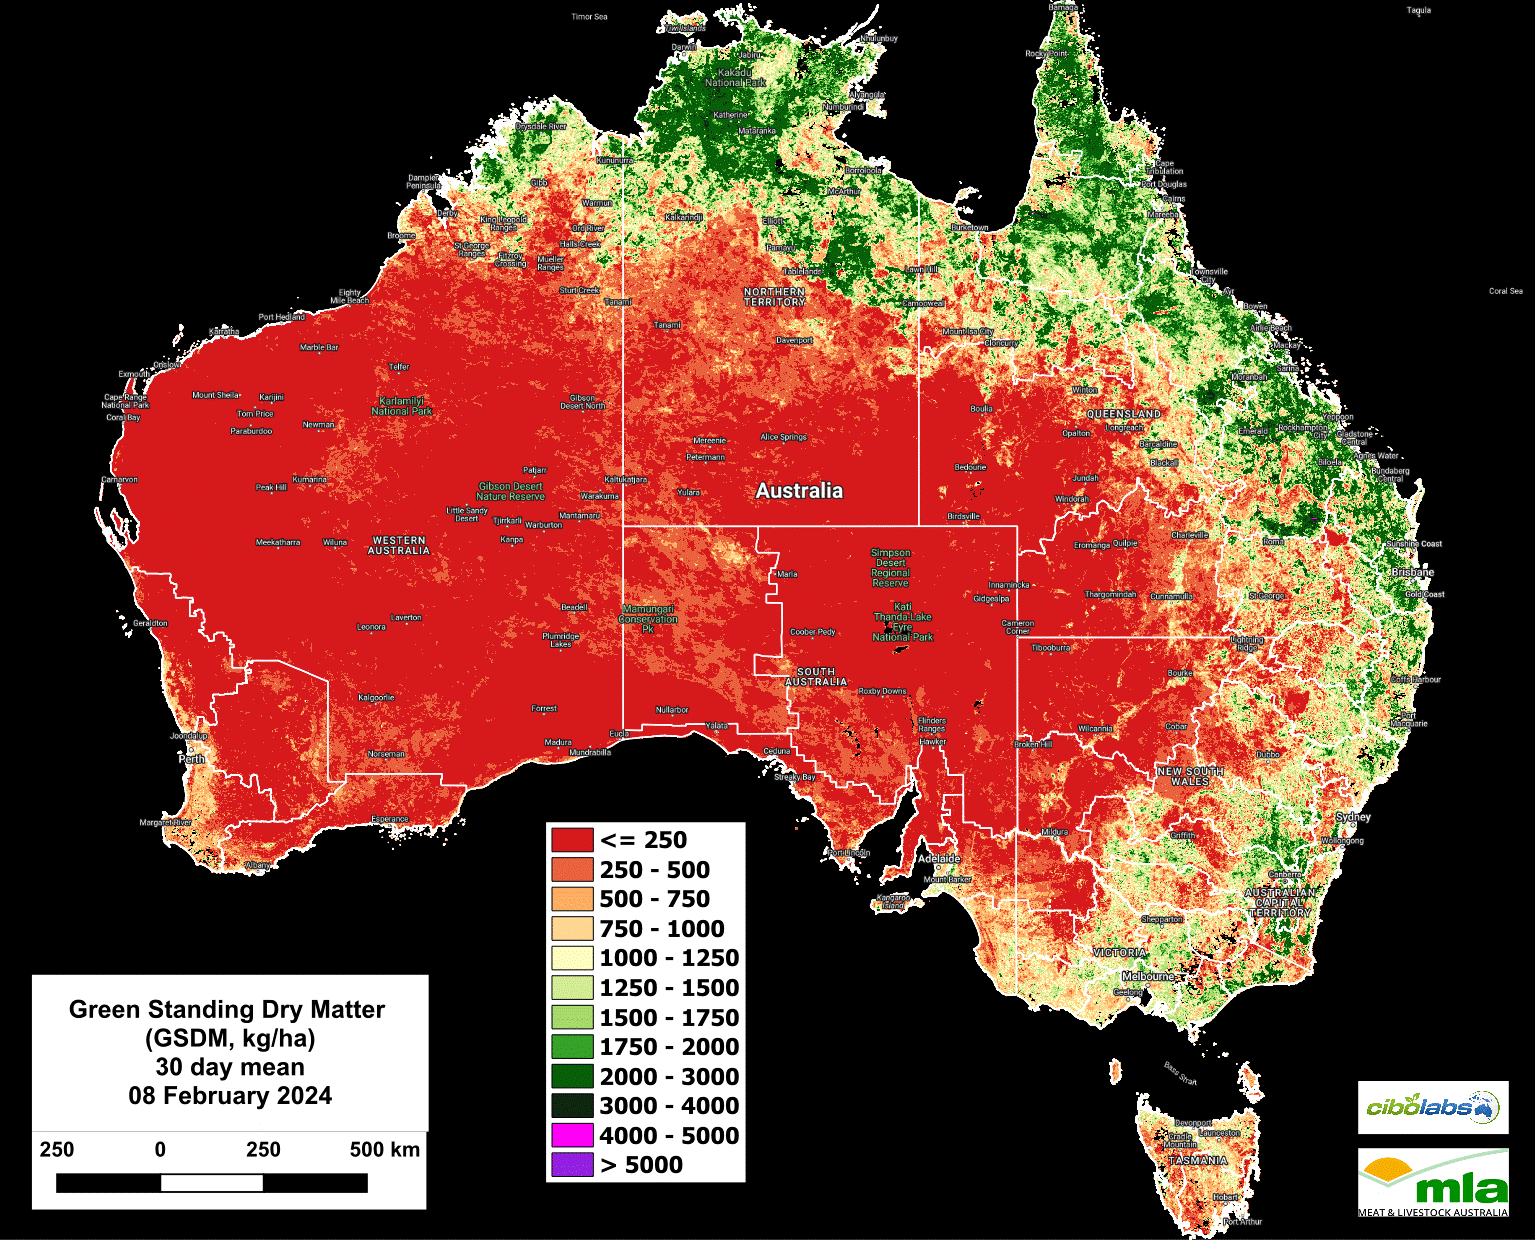
Image 4 – Green Standing Dry Matter
Green Standing dry matter levels are largely in line with the images displayed by Fractional Cover. (Image 4).
Of note is the rapid increase in Green Standing Dry Matter in the Top End of the Northern Territory, as well as in the eastern Gulf and Cape York region of Queensland.
In these areas recordings over 2000kg Green Standing Dry Matter / Ha have significantly increased in the two weeks since the previous updates.
Dead Standing Dry Matter
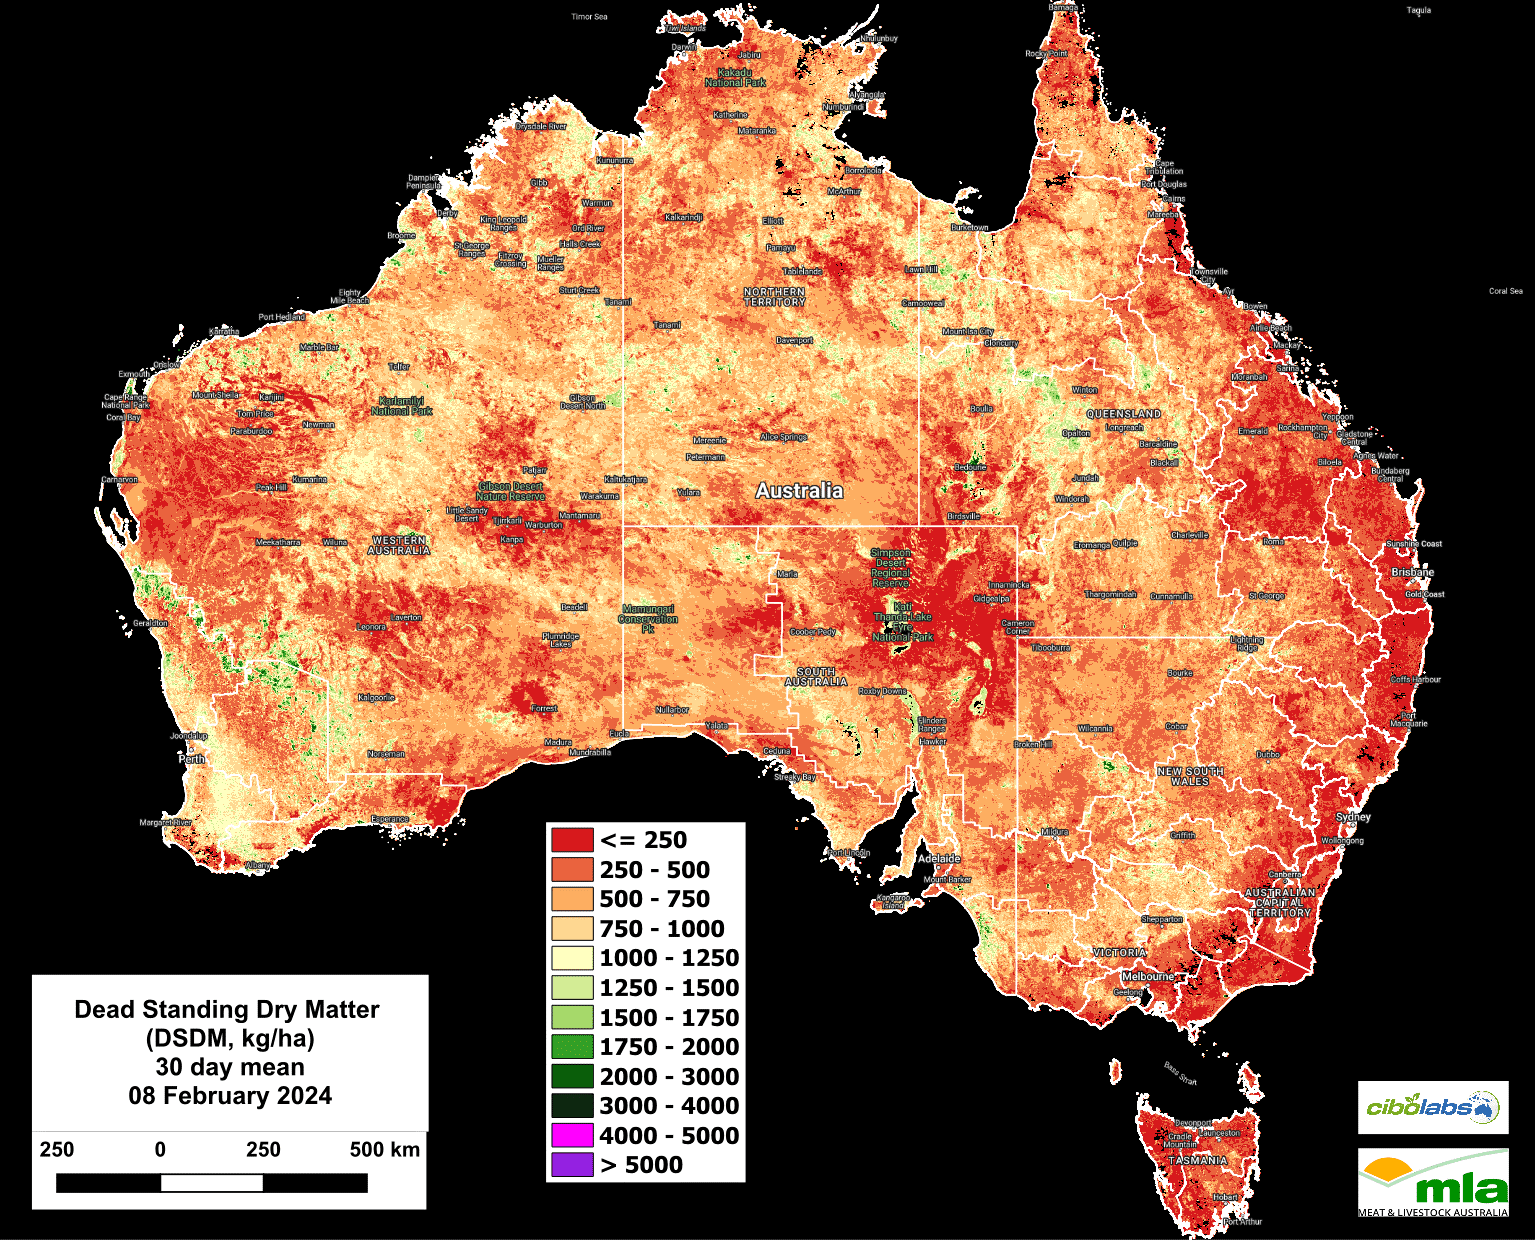
Image 5 – Dead Standing Dry Matter
Dead Standing Dry Matter have not significantly altered from the previous updates, with levels of Dead Standing Dr Matter to be at or below 500kg/DM/Ha.
The exceptions continue to be areas of dead material and carry over feed along watercourses in north and central Qld, southern NSW, the Flinders Ranges in SA and along a line extending from north of Geraldton to west of Kalgoorlie in Western Australia.
Monthly Ground Cover levels
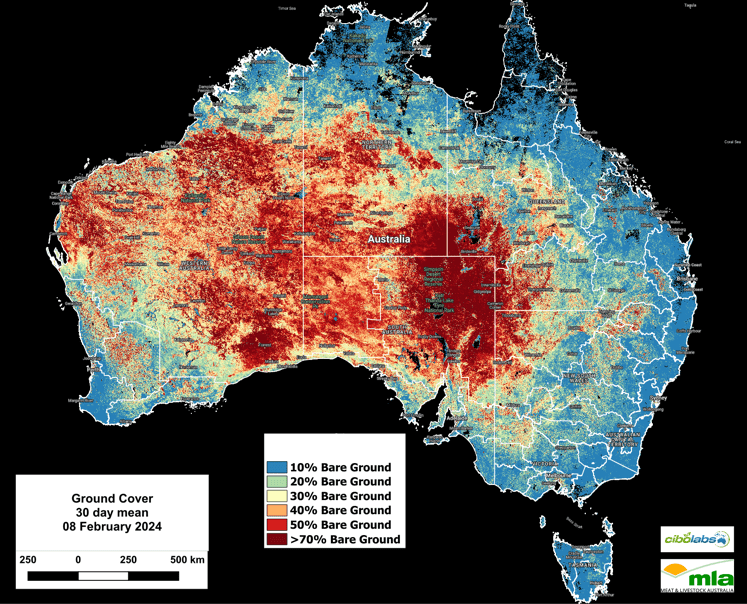
Image 6 – Ground Cover
National Ground Cover levels (30-day rolling average – Image 6) continue to improve in those areas of Western Australia such as the Pilbara and Gascoyne regions.
In the eastern states, ground cover levels remain reasonably stable.
For more localised information including regional level overviews, users are encouraged to explore the Cibo Labs Regional Comparison. This tool provides regional data that may show the impact of localised weather or fire events. A further level of detail for individual properties is available for users who have created an Australian Feedbase Monitor account, which can be accessed both through the MyMLA portal or through the Cibo Labs website.
The Cibo Labs National Comparison can be used to freely access these layers (https://www.cibolabs.com.au/products/national-comparsion/) to view the most recent images from a national, state or catchment level.
This tool can complement the Australian Feedbase Monitor which can also be created within the Cibo Labs Web Site www.cibolabs.com.au