THE national rainfall averages for February as reported by the bureau of Meteorology were close to the 1961 -1990 average.
However, the falls recorded in Western Australia, South Australia, Victoria and Tasmania, and small areas of south-eastern Queensland, southern New South Wales and the Top End of the Northern Territory were below the monthly average.
February also saw the mean maximum temperatures as well as evapotranspiration levels above average for most of western and southern Australia.
Many areas also were impacted by severe heatwaves.
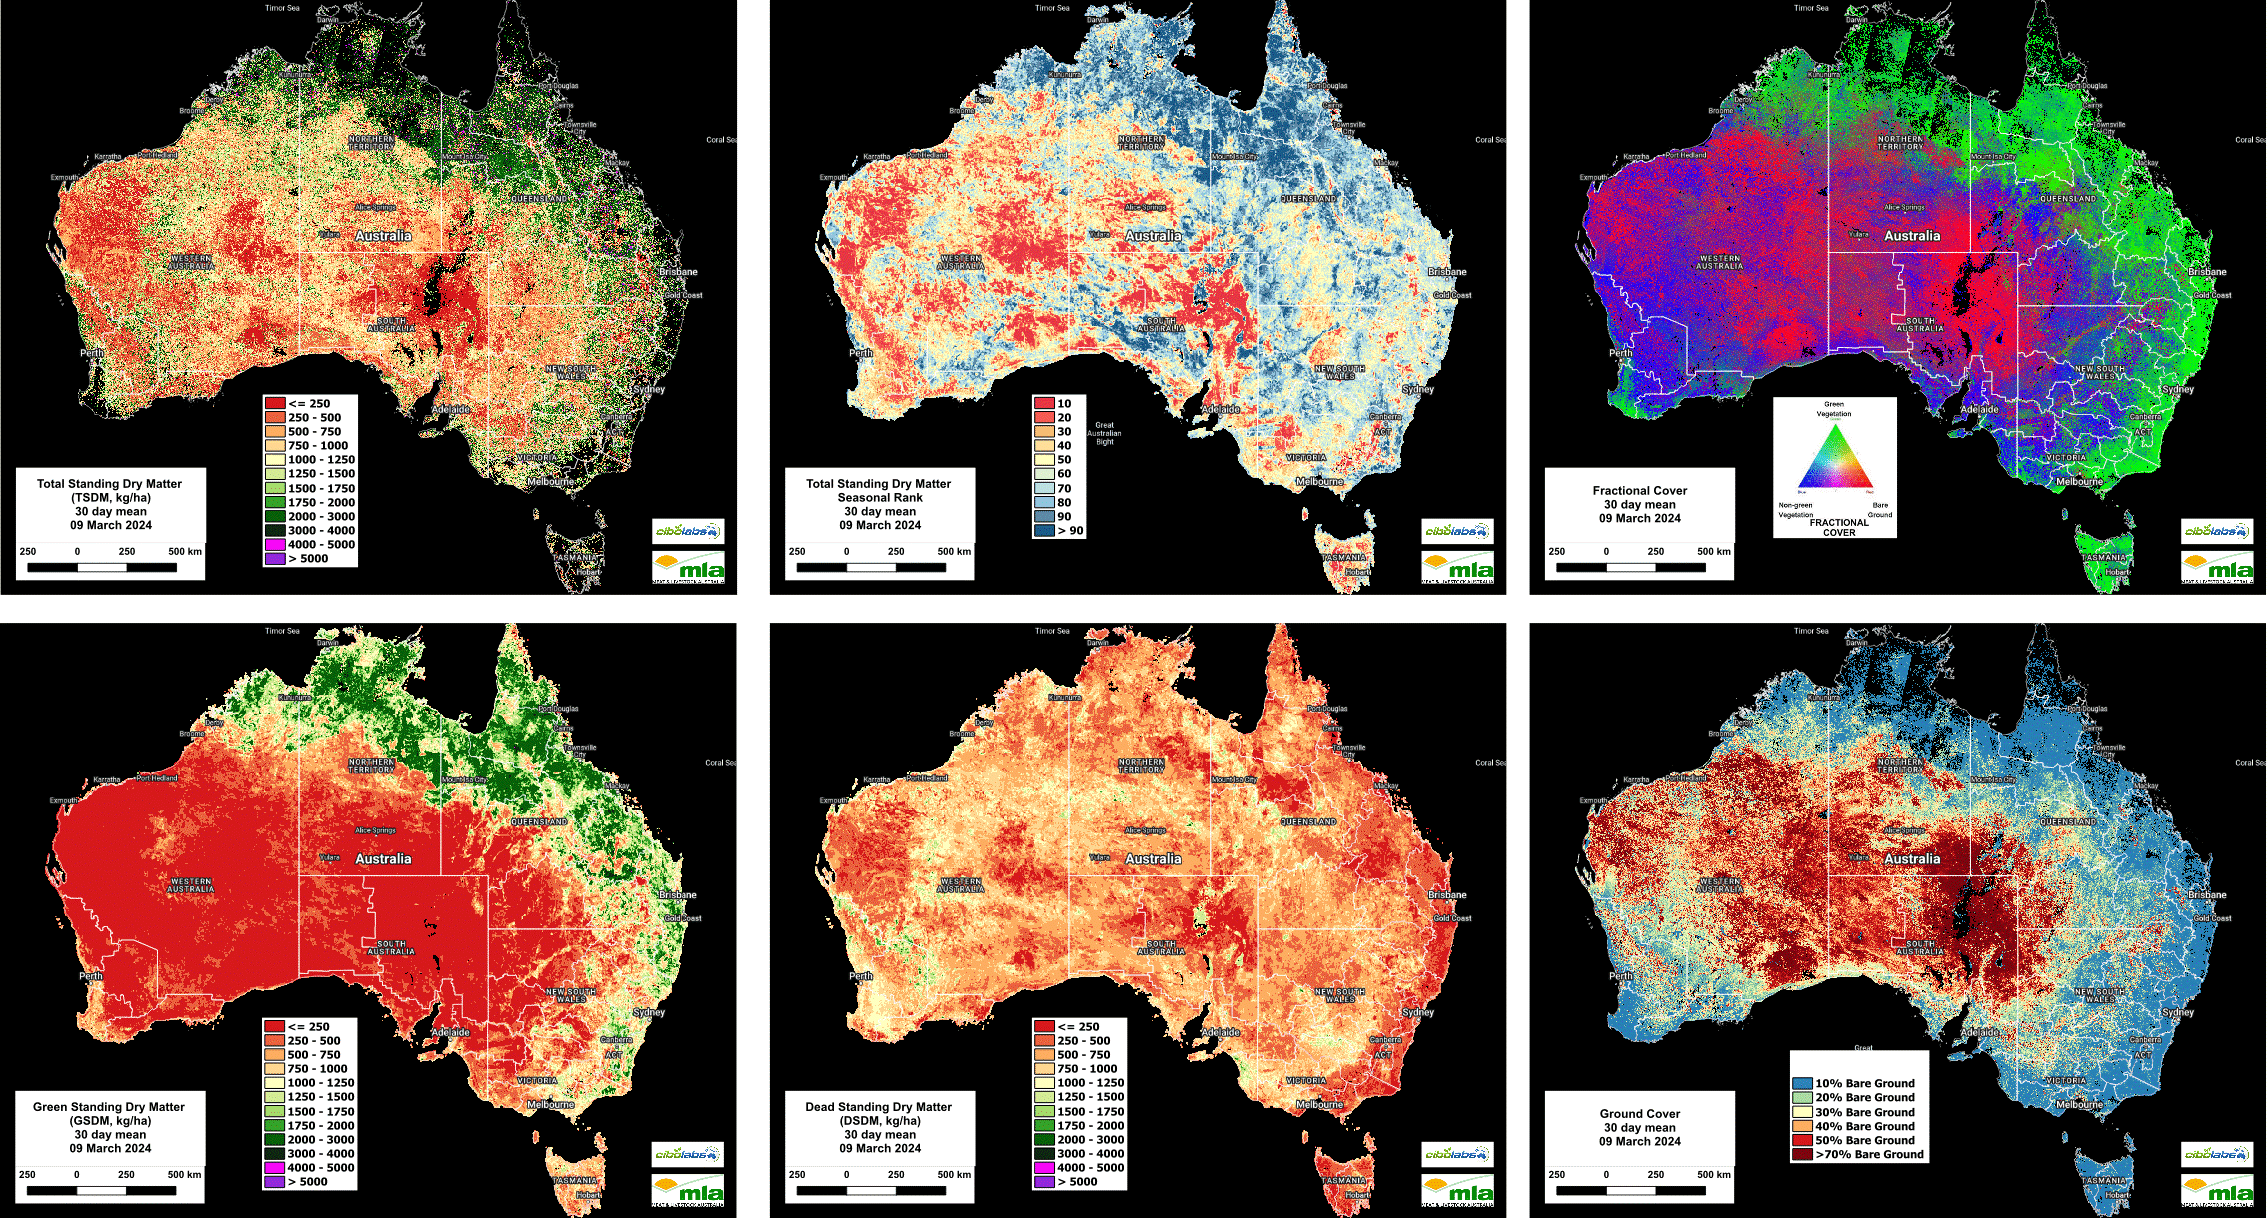
Imagery and analysis provided by CiboLabs
Total Standing Dry Matter
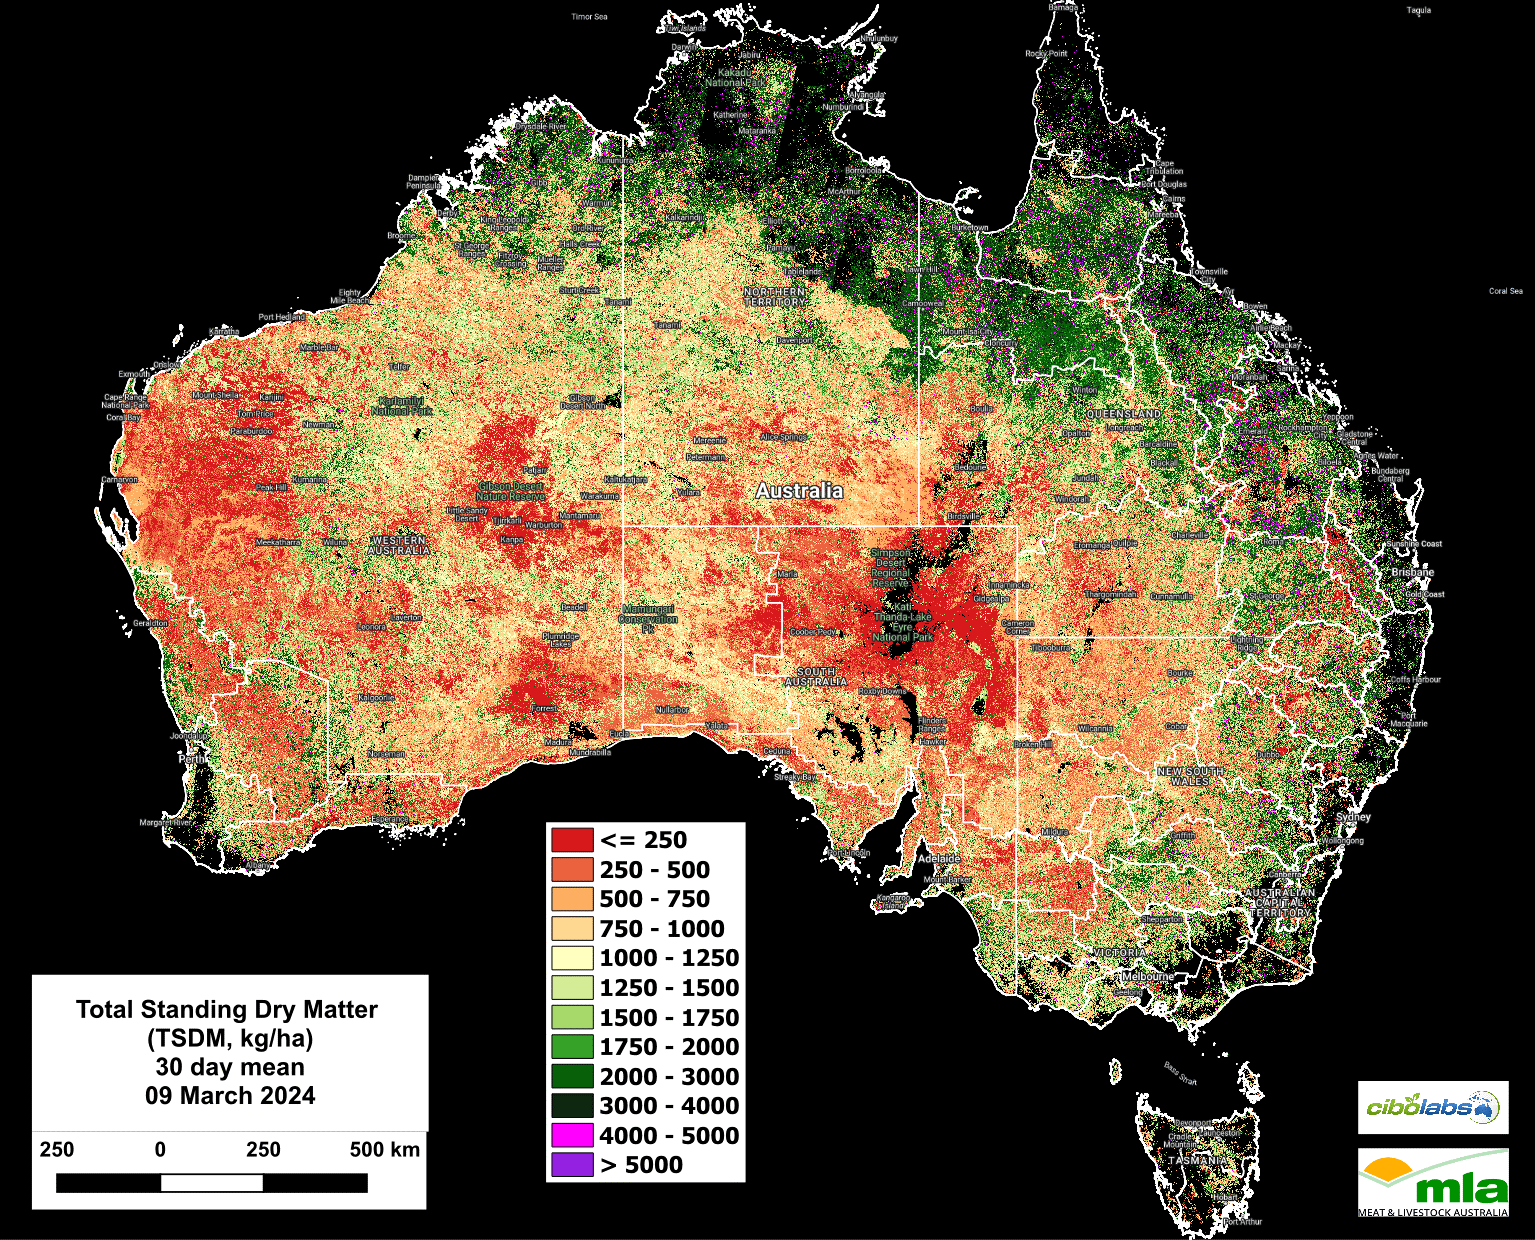
Image 1 – Total Standing Dry Matter (Kg/Ha)
The combination of drier conditions and high temperatures has restricted and, in some cases, reduced herbage biomass levels.
The Total Standing Dry Matter recorded on March 9 shows a decline in amounts through those areas of southern and eastern Australia that were impacted by hotter conditions.
However, central, and northern Queensland continues to reflect the ongoing impact of the wet season with high levels of TSDM in the areas north of Winton and east of Cloncurry and north to the Gulf.
Seasonal Comparison Total Standing Dry Matter
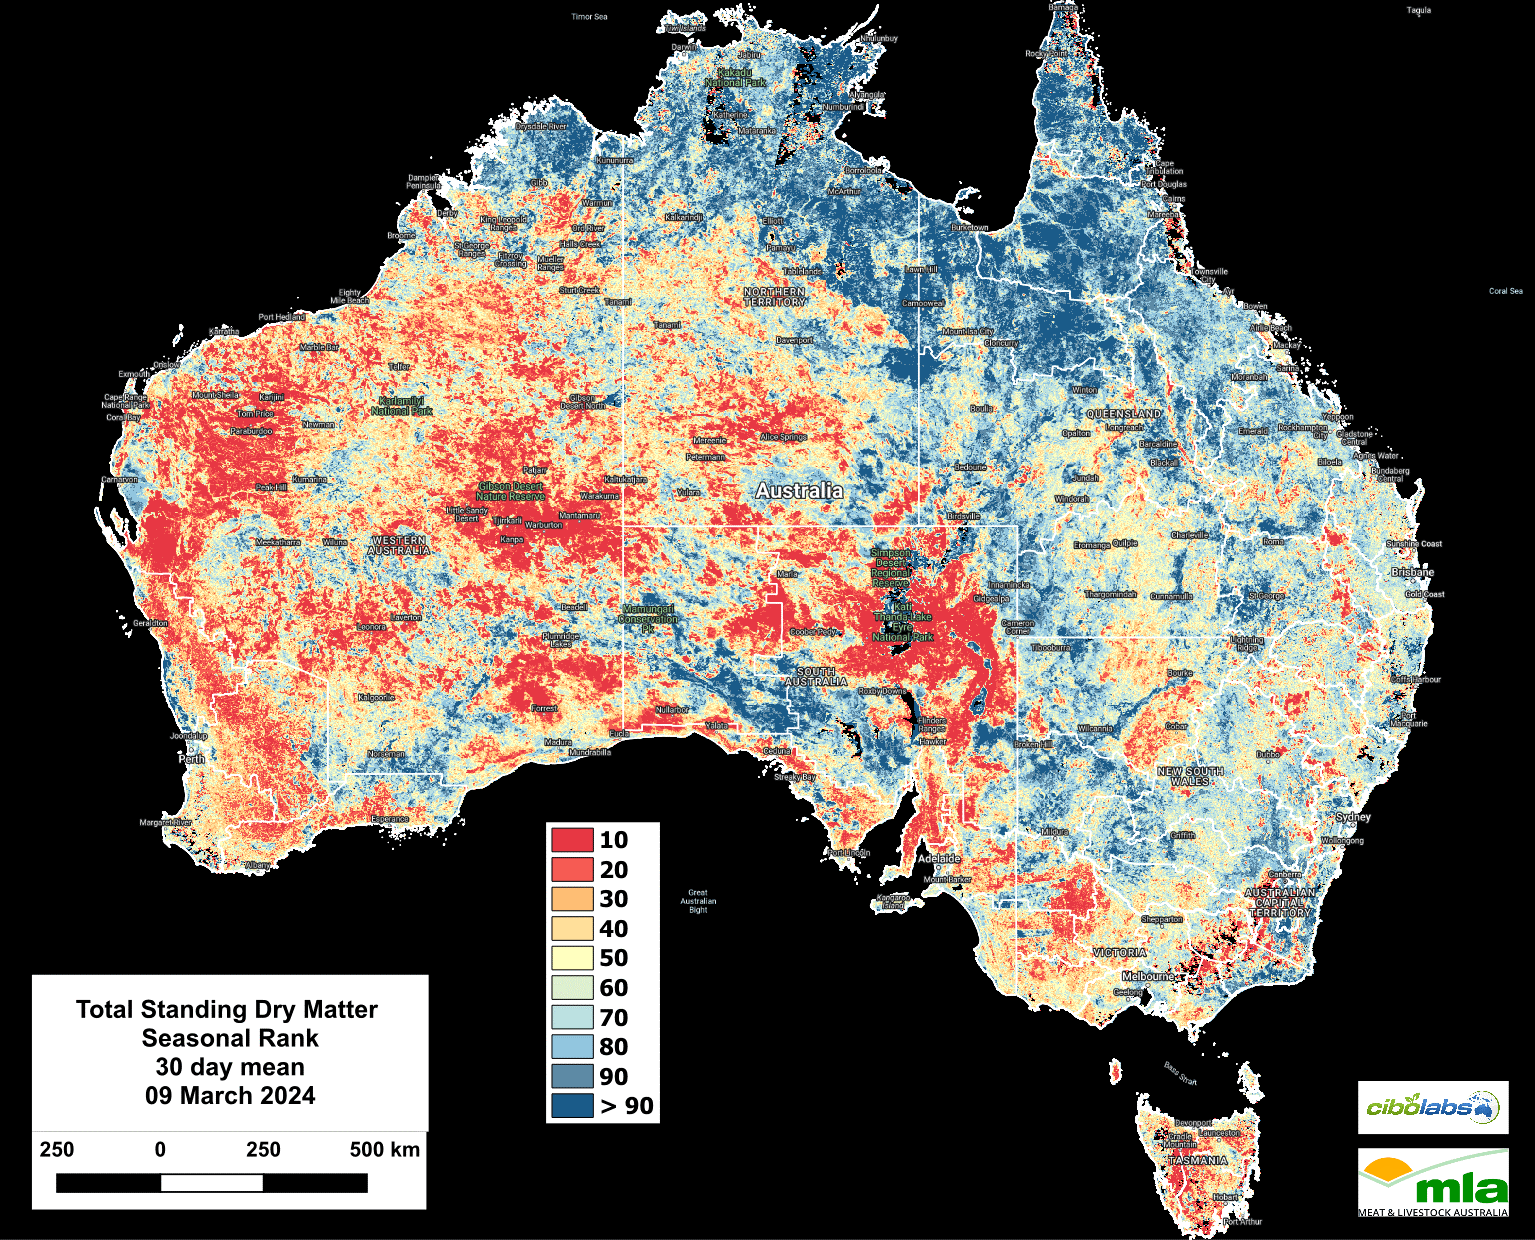
Image 2 – Seasonal Comparison Total Standing Dry Matter
In comparison to the 8-year average (Figure 2) the Barkly tablelands in the NT, and the southern Gulf regions of Queensland remain well above average for this time of the year.
However, for much of central and southern Queensland, NSW and Victoria, seasonal conditions are closer to the 8-year average, with some western and central portions of both states falling below the average.
Western Australia and South Australia continue to fall largely below the average in most regions.
Fractional Cover (Growth)
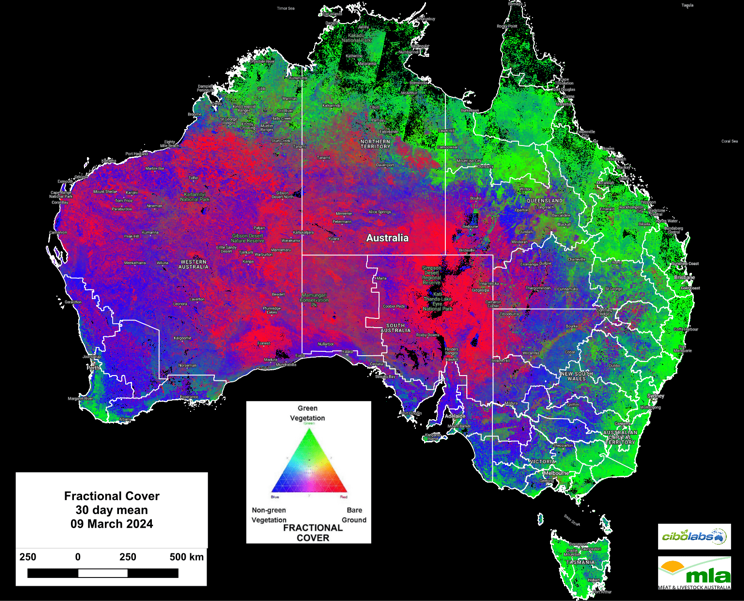
Image 3 – Fractional Cover
Fractional Cover (Image 3) continues to indicate large areas of active growth along the eastern seaboard and the southwest corner of Western Australia.
However, the impact of the hot conditions has seen a contraction in active growth in central NSW, Victoria, and South Australia.
The only significant increases in active growth remain centred on the southern Gulf regions of Queensland, reflecting the ongoing influence of recent wet season events.
Green Total Standing Dry Matter
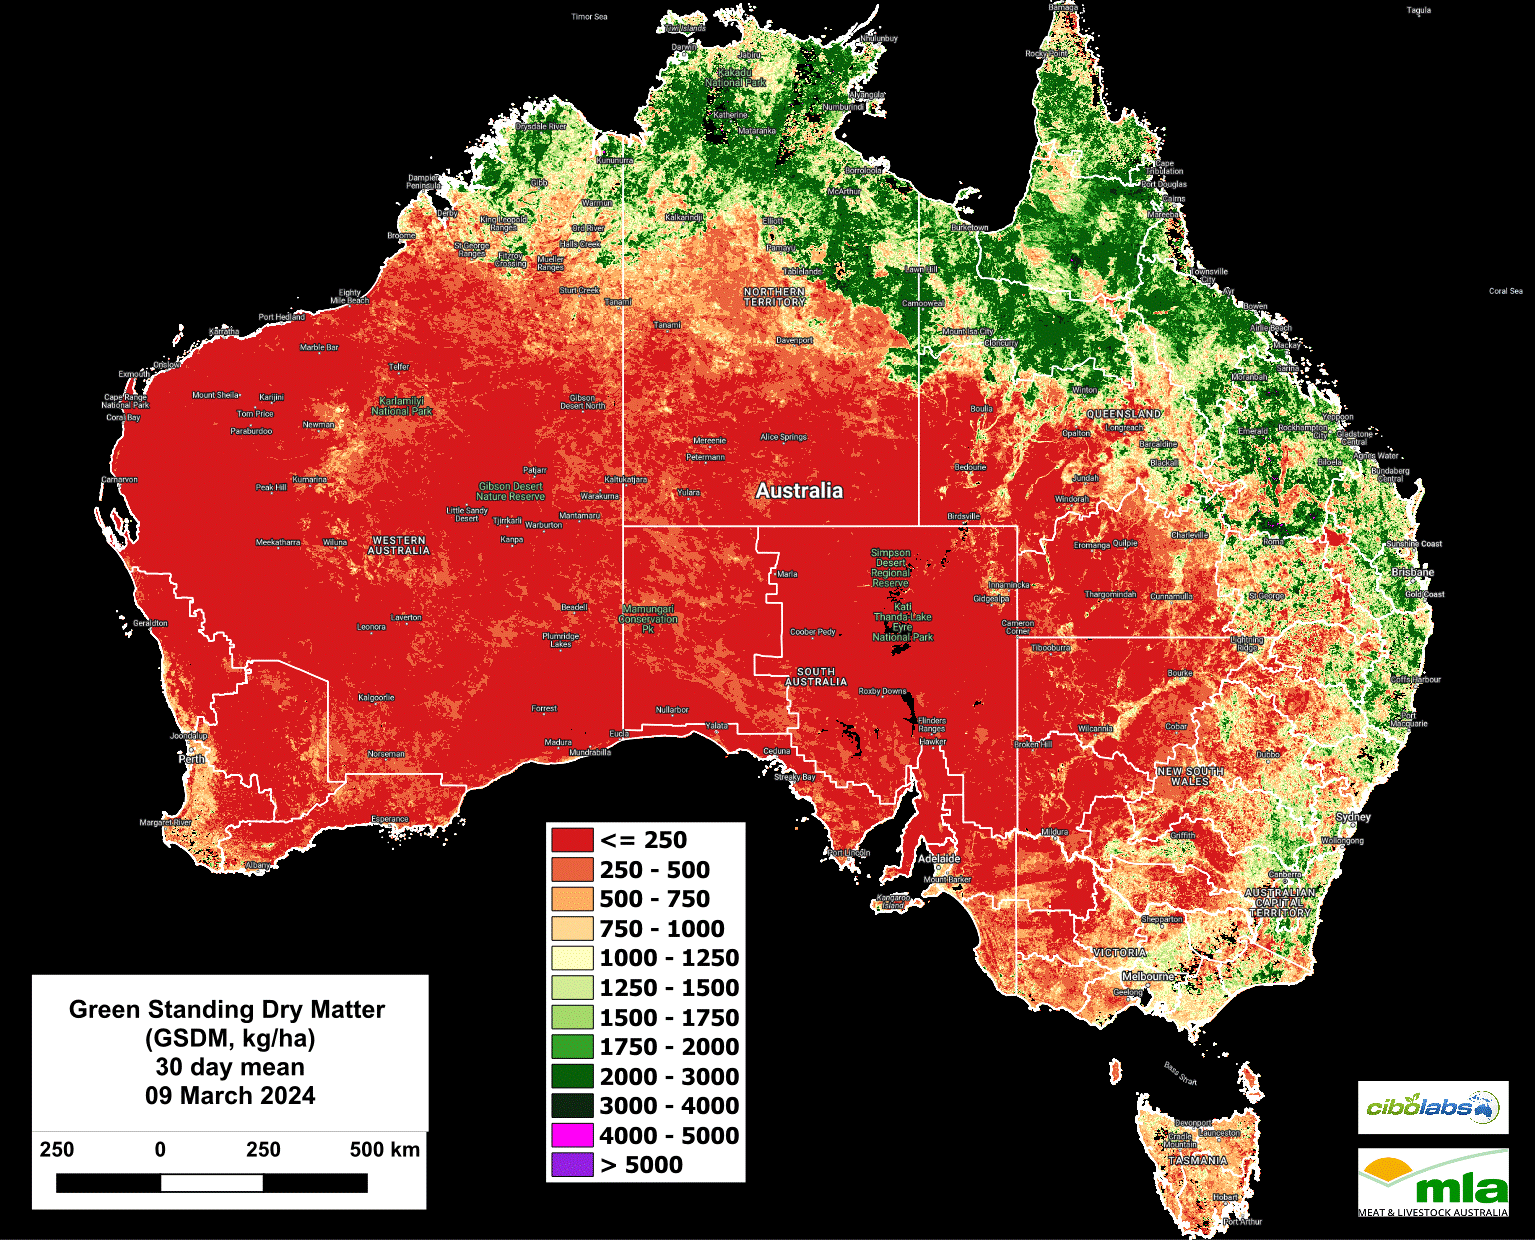
Image 4 – Green Standing Dry Matter
As indicated by the growth events in the Fractional Cover images, the accumulation of Green Standing Dry Matter is greatest in those northern regions of Queensland and the Barkly in the Northern Territory.
While there are still average to high levels of Green Standing Dry Matter along the eastern regions of Queensland and NSW there is a noticeable decline in the overall totals and a constriction eastward, reflecting recent hot weather (Image 4).
Dead Standing Dry Matter
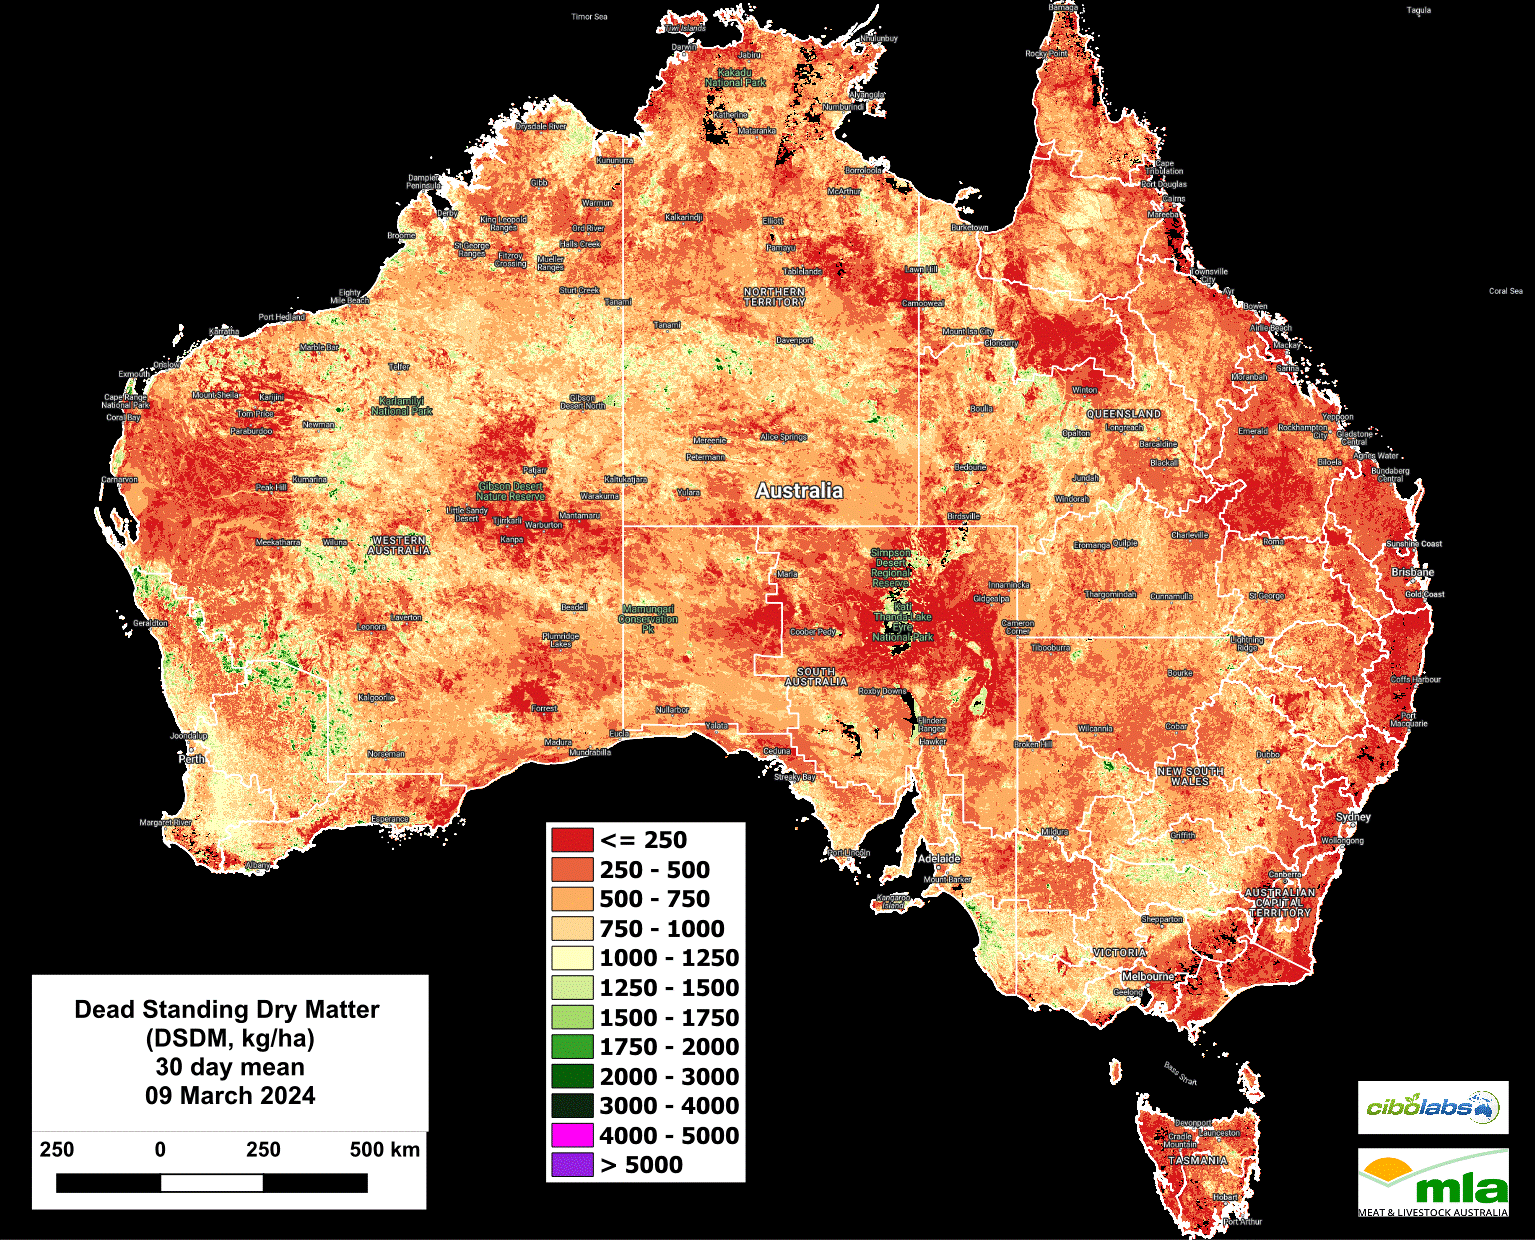
Image 5 – Dead Standing Dry Matter
Dead Standing Dry Matter amounts (Image 5) continue to remain largely unchanged.
This suggests in many areas herbage mass has not increased significantly in the growth phases to reach maturity and senesce.
While there may be large areas of dead material as a result of hot and dry conditions, this material has either detached or did not achieve total amounts exceeding 500kg DM/Ha.
The exceptions are along the major waterways leading to the Channel country in Queensland and in Western Australia west of Geraldton and southeast to Kalgoorlie.
Monthly Ground Cover levels
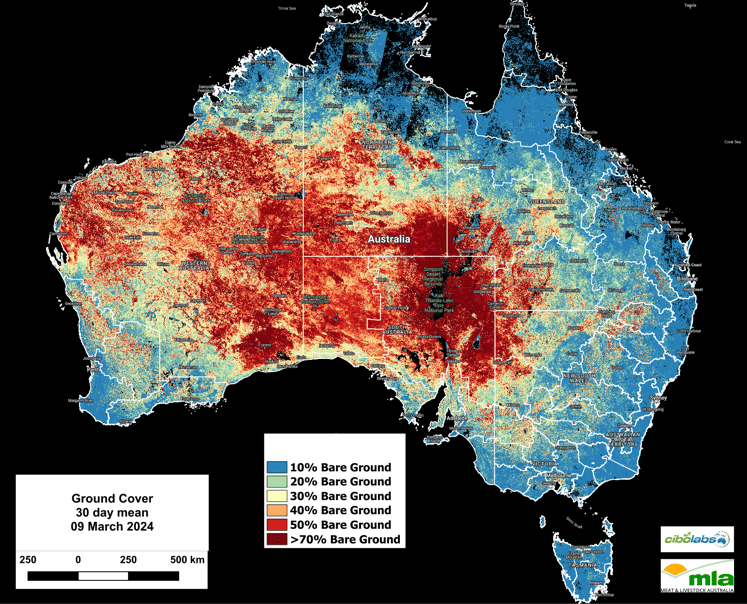
Image 6 – Ground Cover
There has been a slight decrease of ground cover in Central and Western NSW in the past 15 days.
This decrease in ground cover potentially reflects the hot February conditions. Elsewhere, ground cover levels remain largely similar to previous observations. (Image 6)
For more localised information including regional level overviews, users are encouraged to explore the Cibo Labs Regional Comparison. This tool provides regional data that may show the impact of localised weather or fire events. A further level of detail for individual properties is available for users who have created an Australian Feedbase Monitor account, which can be accessed both through the MyMLA portal or through the Cibo Labs website.
The Cibo Labs National Comparison can be used to freely access these layers (https://www.cibolabs.com.au/products/national-comparsion/) to view the most recent images from a national, state or catchment level.
This tool can complement the Australian Feedbase Monitor which can also be created within the Cibo Labs Web Site www.cibolabs.com.au