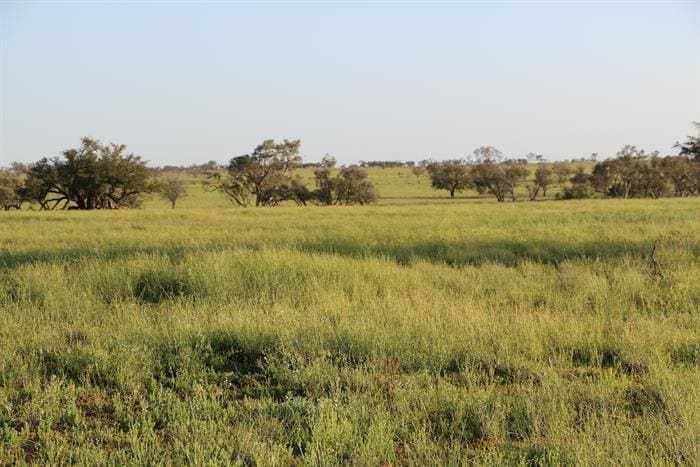
Looking at the figures set out below, it certainly appears that the Blackall property market (illustrated above) is over-priced because people are paying as much per 1mm of rain as they are in Taroom.
IS THERE a relationship between rainfall and different regional Queensland property market values?
Will McLay, a rural manager at Herron Todd White, certainly thinks so and has come up with a novel approach to observe the relativity between rainfall and property markets across the state.
At a recent presentation to HTW’s annual rural property market breakfast in Brisbane, he used six regions – Northern Downs, Central Qld, Blackall, Channel Country, Taroom and Condamine/Roma – broadly covering the main beef cattle production areas of Queensland, to illustrate his points.

HTW valuer, Will McLay
Mr McLay said it was a highly subjective approach due to the judgement of stocking rates, beast area values and rainfall data, but worthy of observation given recent market trends.
“Given the variation of the dry years Queensland has experienced, it is a way of looking at what the market will pay in these different districts, per millimetre of rainfall for that location. In other words, simply dividing the beast area value for a particular location by the historical rainfall amount and comparing the resulting value per 1mm of rainfall against other areas of Queensland.”
Mr McLay was prompted to look at the relativity between different areas after a fund manager explained he was assessing a particular area based on rainfall reliability.
“He was not interested in the median rainfall. Rather, he focussed on the tougher years, rejecting property markets that experienced lower rainfall years more frequently.”
If that’s the case, then it is interesting to consider why buyers are paying higher prices for properties in more volatile rainfall areas. Are they looking beyond the dry conditions, and are they looking at the better performing years?
Just an observation
Mr McLay admitted it was by no means a method of evaluation, and was not even a primary or secondary consideration, but merely an observation of relativity trends in this market.
“There are many other factors the market evaluates. This approach is an observation of relativity, based on a determination of beast area values in each of those different markets,” he said.
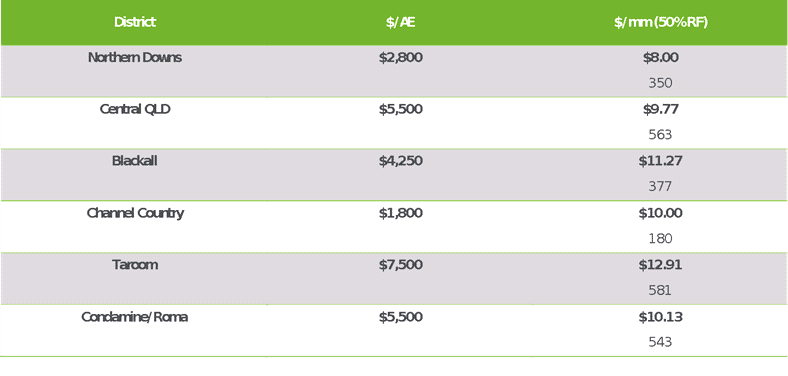
The above table broadly looks at what type of beast area values are being achieved in the six nominated areas.
The second column shows the average annual rainfall – in other words, the average/median rainfall received in 50 percent of the years.
Looking at the relativity, the property market recognises that Taroom at $12.91 is a higher rainfall area and accordingly, it shows the highest value per 1mm of median rainfall compared to Northern Downs region, which is a lighter rainfall district and is rated at $8.
Mr McLay said interestingly, the Channel Country is rated at $10.
“The point of relevance here is that the region benefits from non-local rain events – as evidenced recently in Queensland’s north and gulf country. So then, the rate of $10 per 1mm of median rain seems appropriate given it is only a 180mm local rainfall area.”
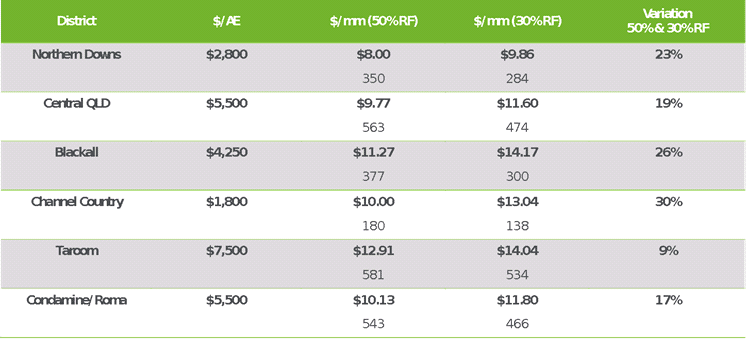
In Table 2, Mr McLay introduced a 30 percent rainfall factor – the rainfall received in 30pc or less years.
It shows in 50pc of years, the Northern Downs will receive 350mm of rain compared to 284mm received in three out of a 10-year season. The difference between those two numbers is 23pc.
However, in Taroom, the same comparison shows only a 9pc variance.
Based on that difference (the values that each showed based on 30pc), it is interesting to note the market at Blackall gained more per 1mm of rainfall in the 30pc year than Taroom.
So, despite a greater variance between average and 30pc seasons, it appears buyers are drawn to the Blackall property market, and this is reflected by stronger values.
Blackall is the highest priced property market based on the 30pc seasonal occurrence, followed by Taroom. The Northern Downs is last on the list.
On this basis, Taroom is probably the most expensive broadscale grazing area per hectare followed by Moura, the Central Highlands, Middlemount, then Blackall, Tambo and Roma.
An interesting paradigm in Table 2 is the relativity between Taroom and Blackall.
Taroom is worth $7500 per beast area, against Blackall at $4250. The market indicates that buyers pay less per beast area in Blackall – most likely because it has lower rainfall, is further from markets and produces less kilos per adult per day a week.
Why then are buyers paying slightly more per 1mm of rainfall than the more secure location at Taroom?
Reasons
Mr McLay thinks producers are prepared to pay higher prices in Blackall because it has long been considered a reliable rainfall area (relative to the surrounding districts).
“Locals acknowledge the rainfall is better in Blackall/Tambo than in Longreach, and this is established by historical records. The figures in Table 2 confirm the market is simply recognising that.”
Mr McLay said another factor was scale.
“Producers seeking to run 2000, 3000, 4000 or 5000 head of cattle can’t find enough country for that enterprise scale in Taroom, but they can in Blackall and that’s the reason why the local property market has been particularly active.”
Conclusion
Looking at the figures, it certainly appears that the Blackall market is over-priced because people are paying as much per 1mm of rain as they are in Taroom.
So, if Blackall is over-priced, is Taroom under-priced?
Mr McLay wouldn’t be drawn into such a conclusion, saying that rainfall is only one of many considerations made by a purchaser when acquiring a property, and there are other factors which influence market forces.
“The figures show Taroom has reasonable pricing if you consider seasonal security as a high priority.”