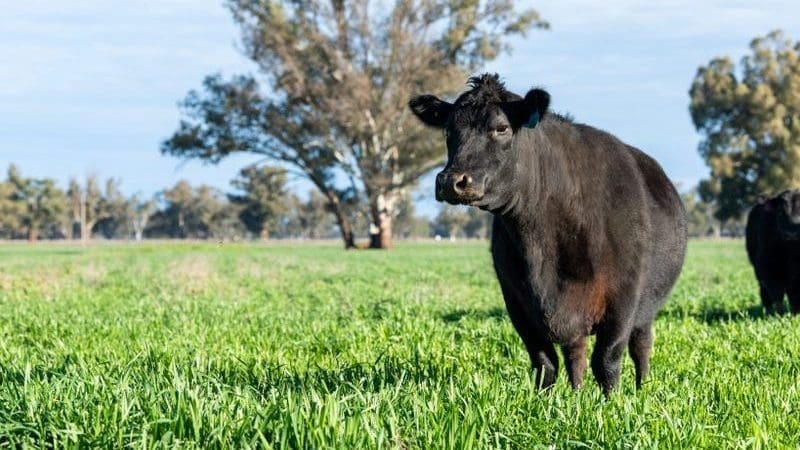
THE unprecedented combination of extended low interest rates, above-average seasons, historically high commodity prices and increased equity levels held by family farmers has been the powerful cocktail that has driven rural property market to new record highs over the past two years.
Combine with that a younger generation of farmers with higher risk appetite now taking over family operations, and the environment has created a perfect storm for ‘remarkable’ changes that have been witnessed in grazing and farming property values, a Brisbane industry audience heard recently.
Speaking during valuer Herron Todd White’s annual property briefing held jointly from Melbourne and Brisbane, HTW’s Melbourne office valuer Graeme Whyte used his company’s annual Australian Grazing Property Index data to illustrate the dramatic changes that have taken place.
As the graph published below shows, a lot of water has passed under the bridge in a property market value sense, since HTW last presented its annual property update in 2020. COVID forced cancellation of the event last year.
HTW’s Graeme Whyte, speaking via online link during the joint Brisbane/Melbourne property outlook summary last month
“It’s been a really exciting time in many ways – none of us have previously seen the sort of changes that have occurred in the last two years – and not many of us would have expected it to have been as dramatic as it has been,” Mr Whyte said.
It had been a unique set of circumstances, he said.
“I cannot remember ever seeing interest rates as low as they currently are, for this long. That’s had impact on all property markets, changing people’s mindsets.”
“On top of that, the rapid increase in property values has had enormous impact on producers’ balance sheets. Everyone’s equity levels now are much higher than what they were, and they are sitting on much greater borrowing capacity.”
“Suddenly, you combine low interest rates with greater borrowing capacity, generally good seasons and high commodity prices, and it fuels the market.”
Mr Whyte said another factor was that agriculture was now seen as an ‘exciting’ space to be in, attracting more young people to go back and get involved in a family farming business.
“There’s a lot of generational change going on, and the next generation is reasonably ambitious – we think they have a higher risk appetite. If you are under 30 years of age, you have never really seen a market downturn. I’m sure that is having an influence on things as well,” he said.
“It’s buyer demand that has led to the extraordinary property value rise. Farmers and graziers over the past two years have felt that now is a great time to be in the industry, and have been prepared to back themselves to buy more land.”
In addressing the question, What happens from here? Mr Whyte said there were some conclusions that could be drawn.
“All the commentary is saying interest rates will rise, but nobody is game to say by how much, or when. That may dampen things a little, but nobody anticipates levels seen ten or 15 years ago.”
Rising input costs was the big issue that would weigh on the market for a lot of producers, he suggested.
“It just costs more to do everything at the moment – whether it be fertiliser prices doubling in the last couple of years, or fuel price hikes. Labour is scarce and more expensive, and imported machinery has jumped in price. The cost of doing business has gone up, across the board, and it is having a significant impact.”
“Perhaps for beef producers the rising costs will not be as severe as for cropping enterprises, and they may just shrug their shoulders, given the price of cattle. But for people thinking about their gross margins in putting in a crop over the next couple of months, costs have gone up dramatically.”
Having said that, on balance it was hard to see anything pushing beef or wheat prices significantly lower, and nobody was yet forecasting a return to drought conditions, Mr Whyte said.
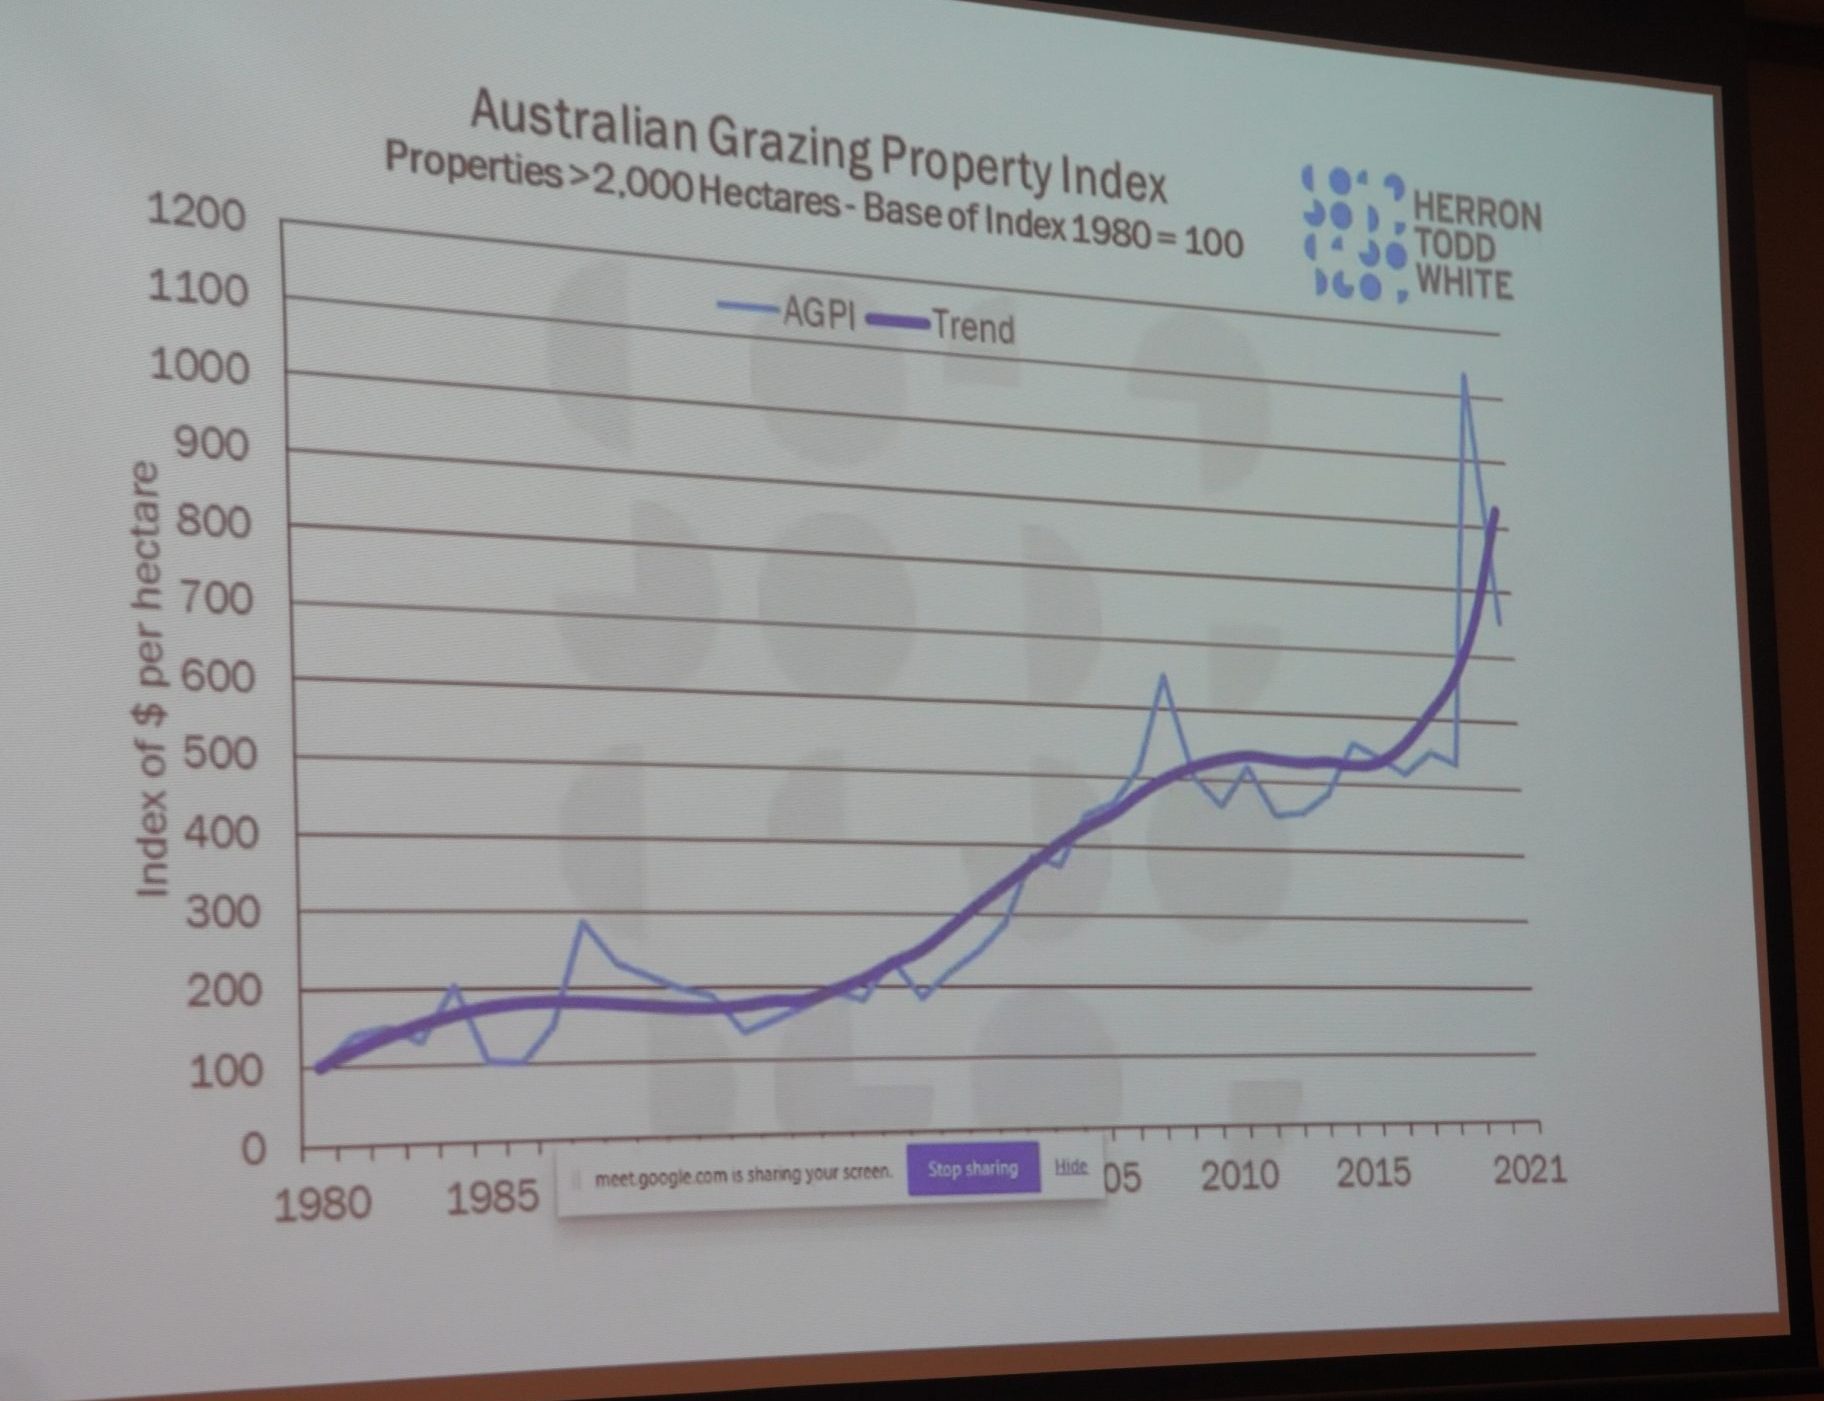
Grazing property Index reflects dramatic trend
HTW’s annual Australian Grazing Property Index is based on all property sales across Australia +2000ha. The theory is that at that size limit, it is mostly likely to be a grazing property involved, rather than mixed farms, or cropping. The index is adjusted for inflation.
As can be seen in the graph below, tracing back to 1980, the growth in values ($/ha basis) seen over the past two years has never been greater, over the 41 years of recorded data.
Click on images for a larger view. Double click for an even larger image
“Like all charts it shows some ups and downs, and periods going sideways,” Mr Whyte said.
“The period around 2008 (flat-line area towards the right of the graph), for example, was a difficult time for a lot of agricultural commodities. But from about 2015-16, conditions, especially commodity prices, started to improve,” he said.
“Two years ago, we were saying yes, the market has risen, and risen significantly, and things are back on track. But as can be seen in the plot line, in the last two years, somebody has put some rocket-fuel under the market. Particularly in the grazing sector, the market has just exploded,” Mr Whyte said.
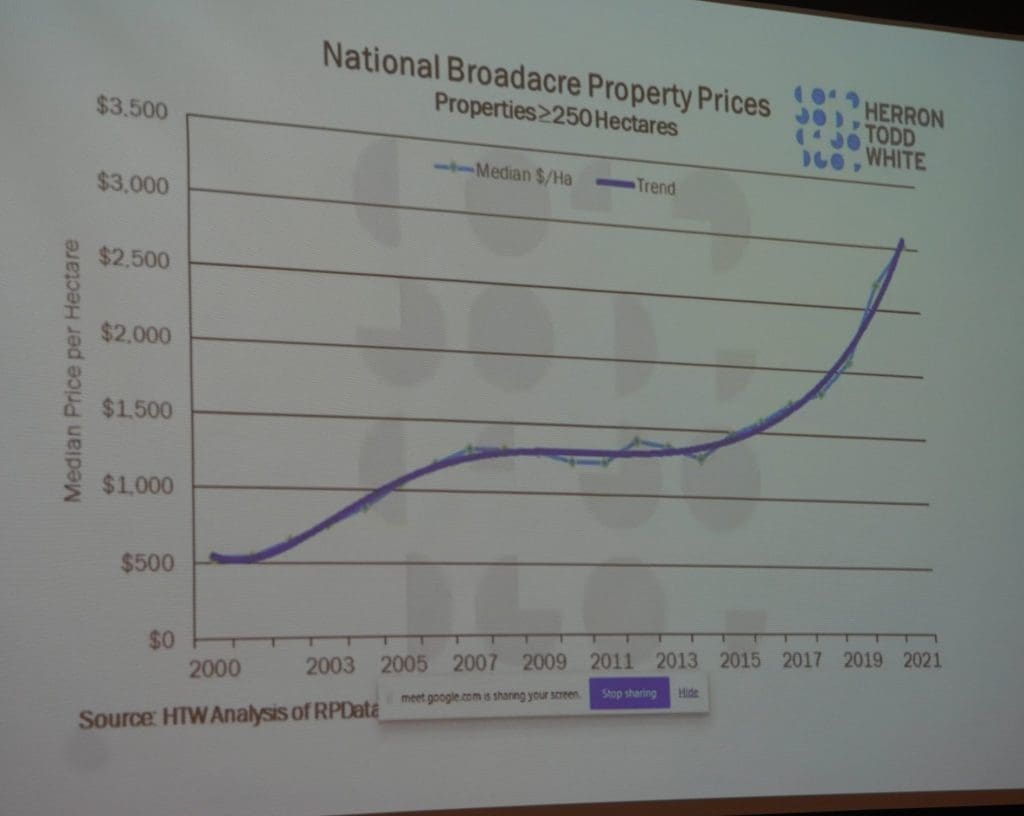
In the second graph below, based on national broadacre prices for property transactions greater than 250ha (picking up more cropping properties, and relatively more sales in southern Australia), the trend line is very similar.
Property turnover
“Looking at explosive growth like this, it’s natural to ask, what is happening? Is there something we need to better understand?” Mr Whyte said.
He said one of the factors that influenced the index trend was the number of sales involved each year.
At a national level, the graph below plots the number of property sales recorded annually across Australia, greater than 250ha, over the past 21 years.
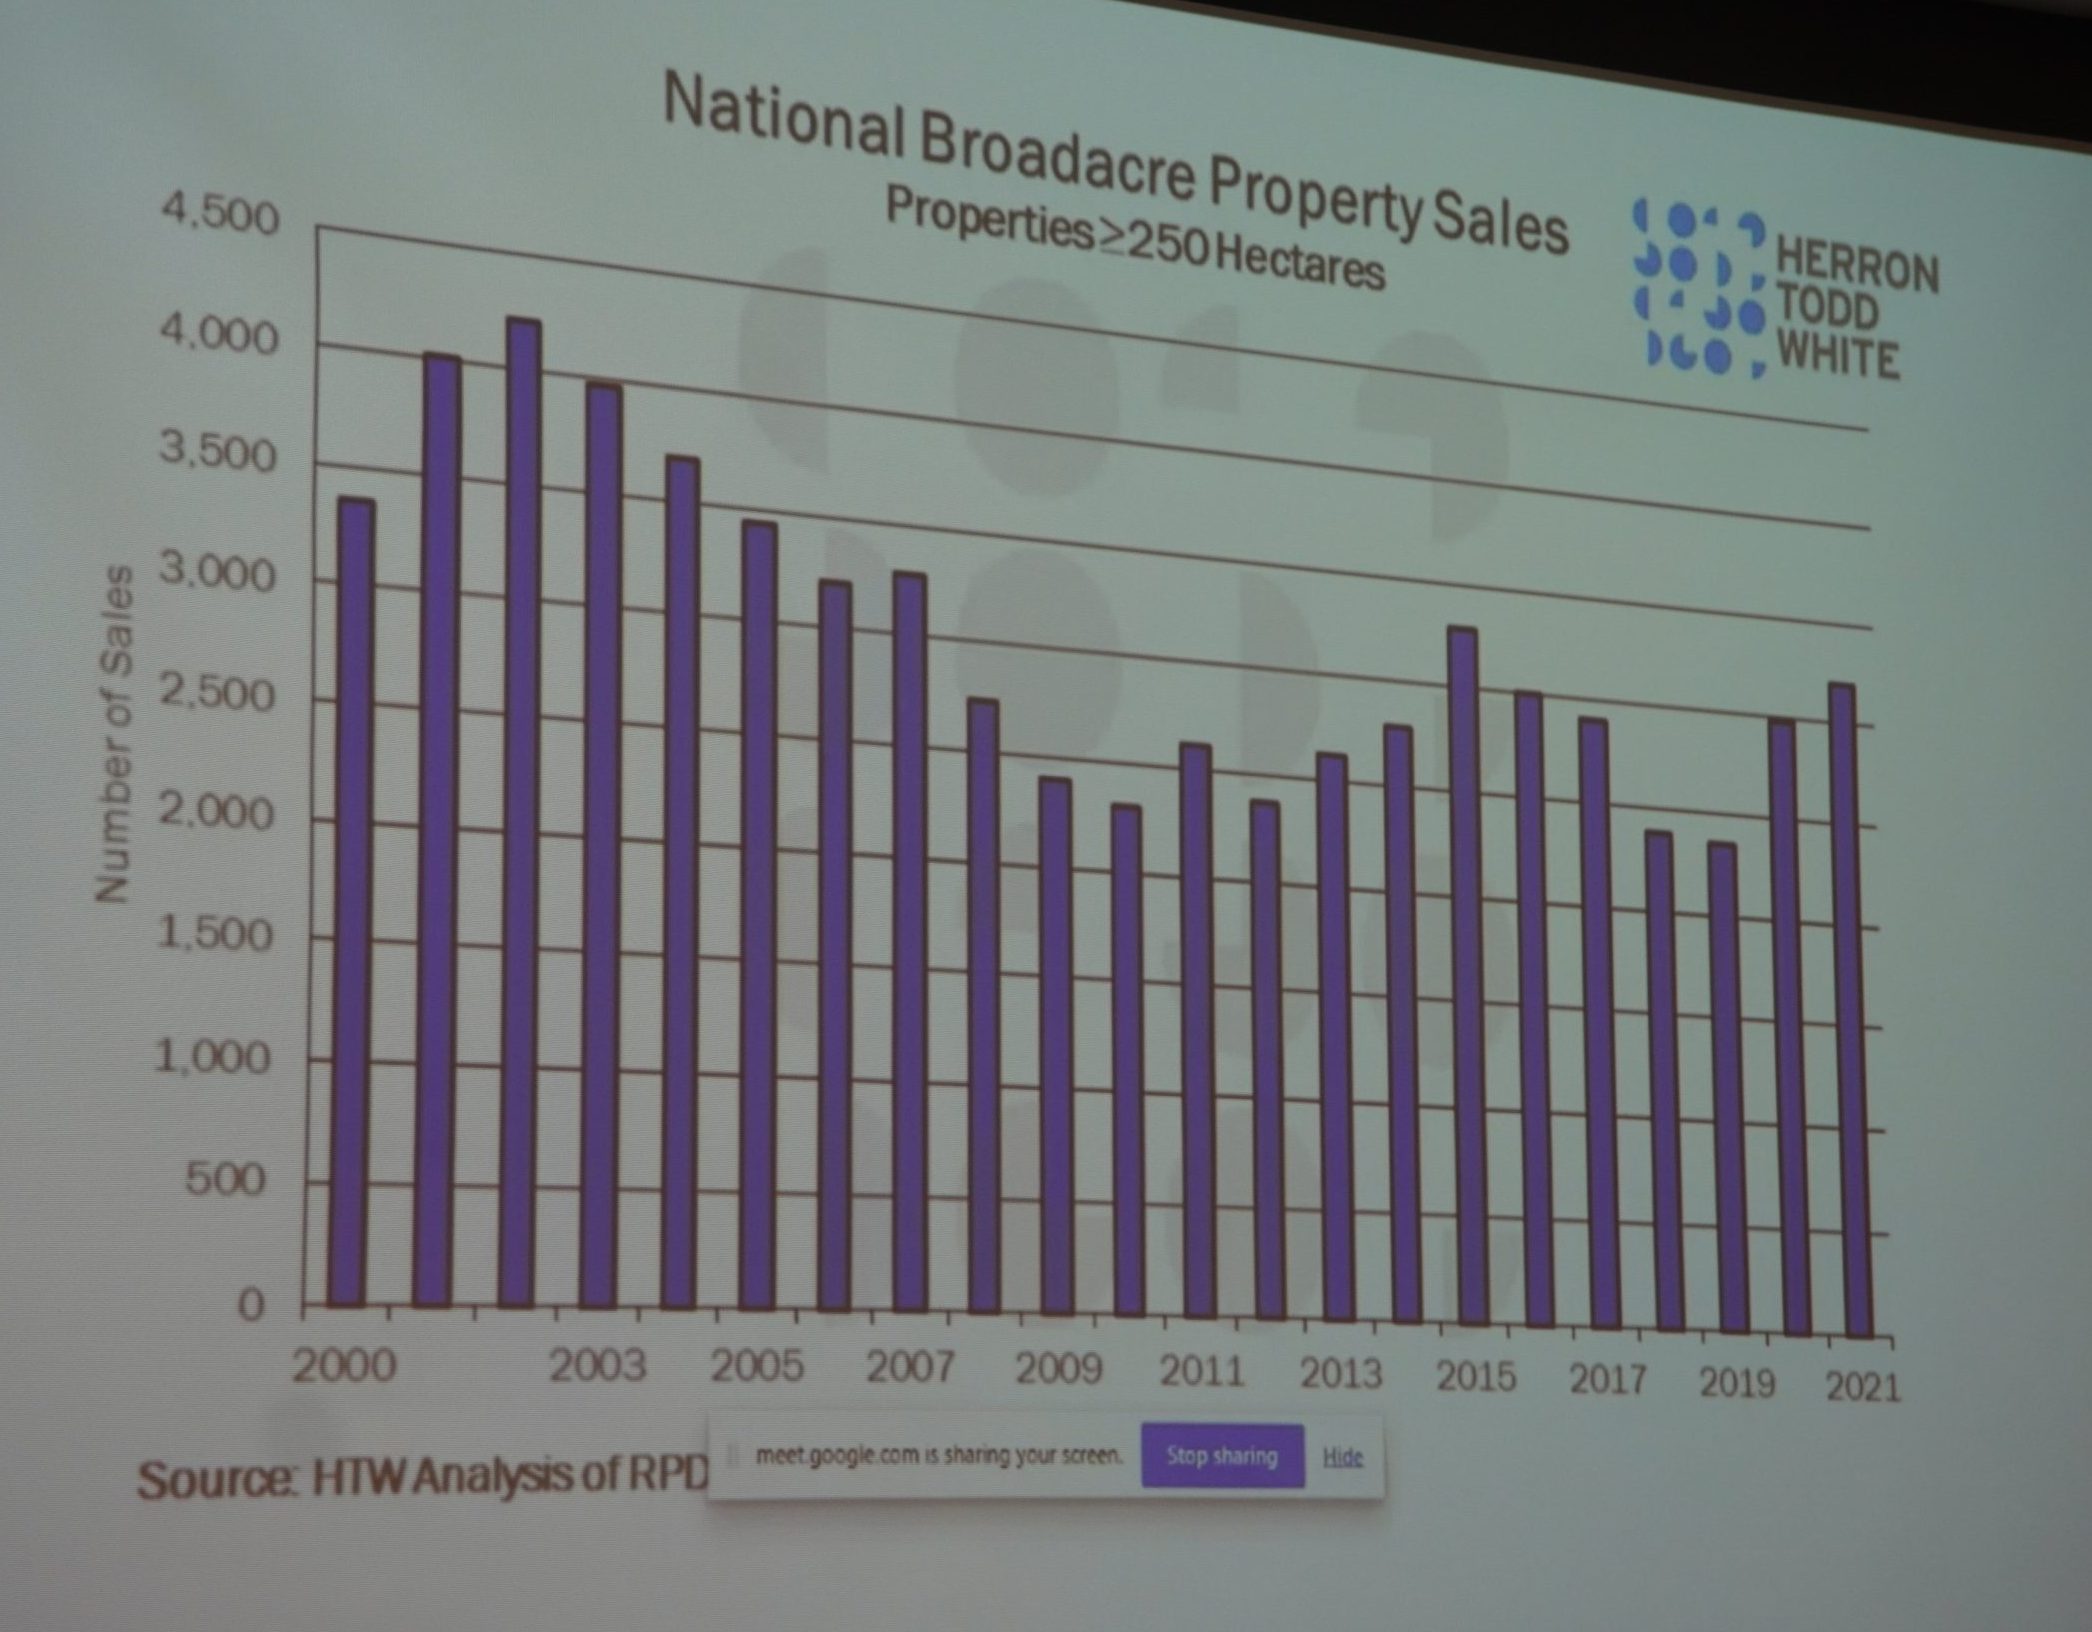
There was clearly a spike seen around 2015, and prior to that, there was a much larger volume of property sales occurring in the early 2000s, when turnover peaked above 4000 properties/year, before falling away to around 2300 in 2010.
“Numbers of sales have been relatively stable in more recent times – if anything increasing a little over the last couple of years,” Mr Whyte said.
“We often talk about limited supply, and not enough properties on the market, to meet demand. That may be true in some regions, but the actual number of transactions has not been declining lining in recent times.”
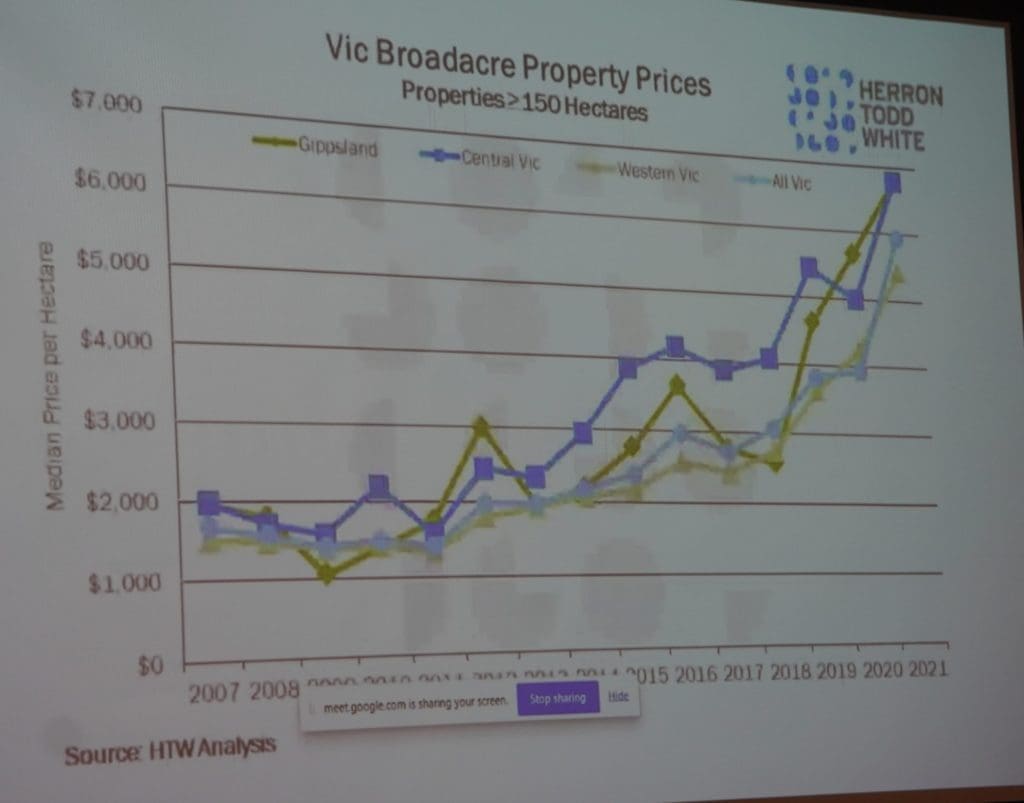
Mr Whyte drilled down into different regions in southern Australian property market, using the chart below to illustrate Victorian broadacre (+150ha) property prices since 2007, by region.
“It shows a similar trend – there have been times when some regions of Victoria have had a more pronounced shift than others, but over the last few years, pretty much everywhere in the state has enjoyed a significant uplift in values.
When bulking the Gippsland, central Victoria and western Victoria together, the rates per hectare were not all that different.
Click on image for a larger view
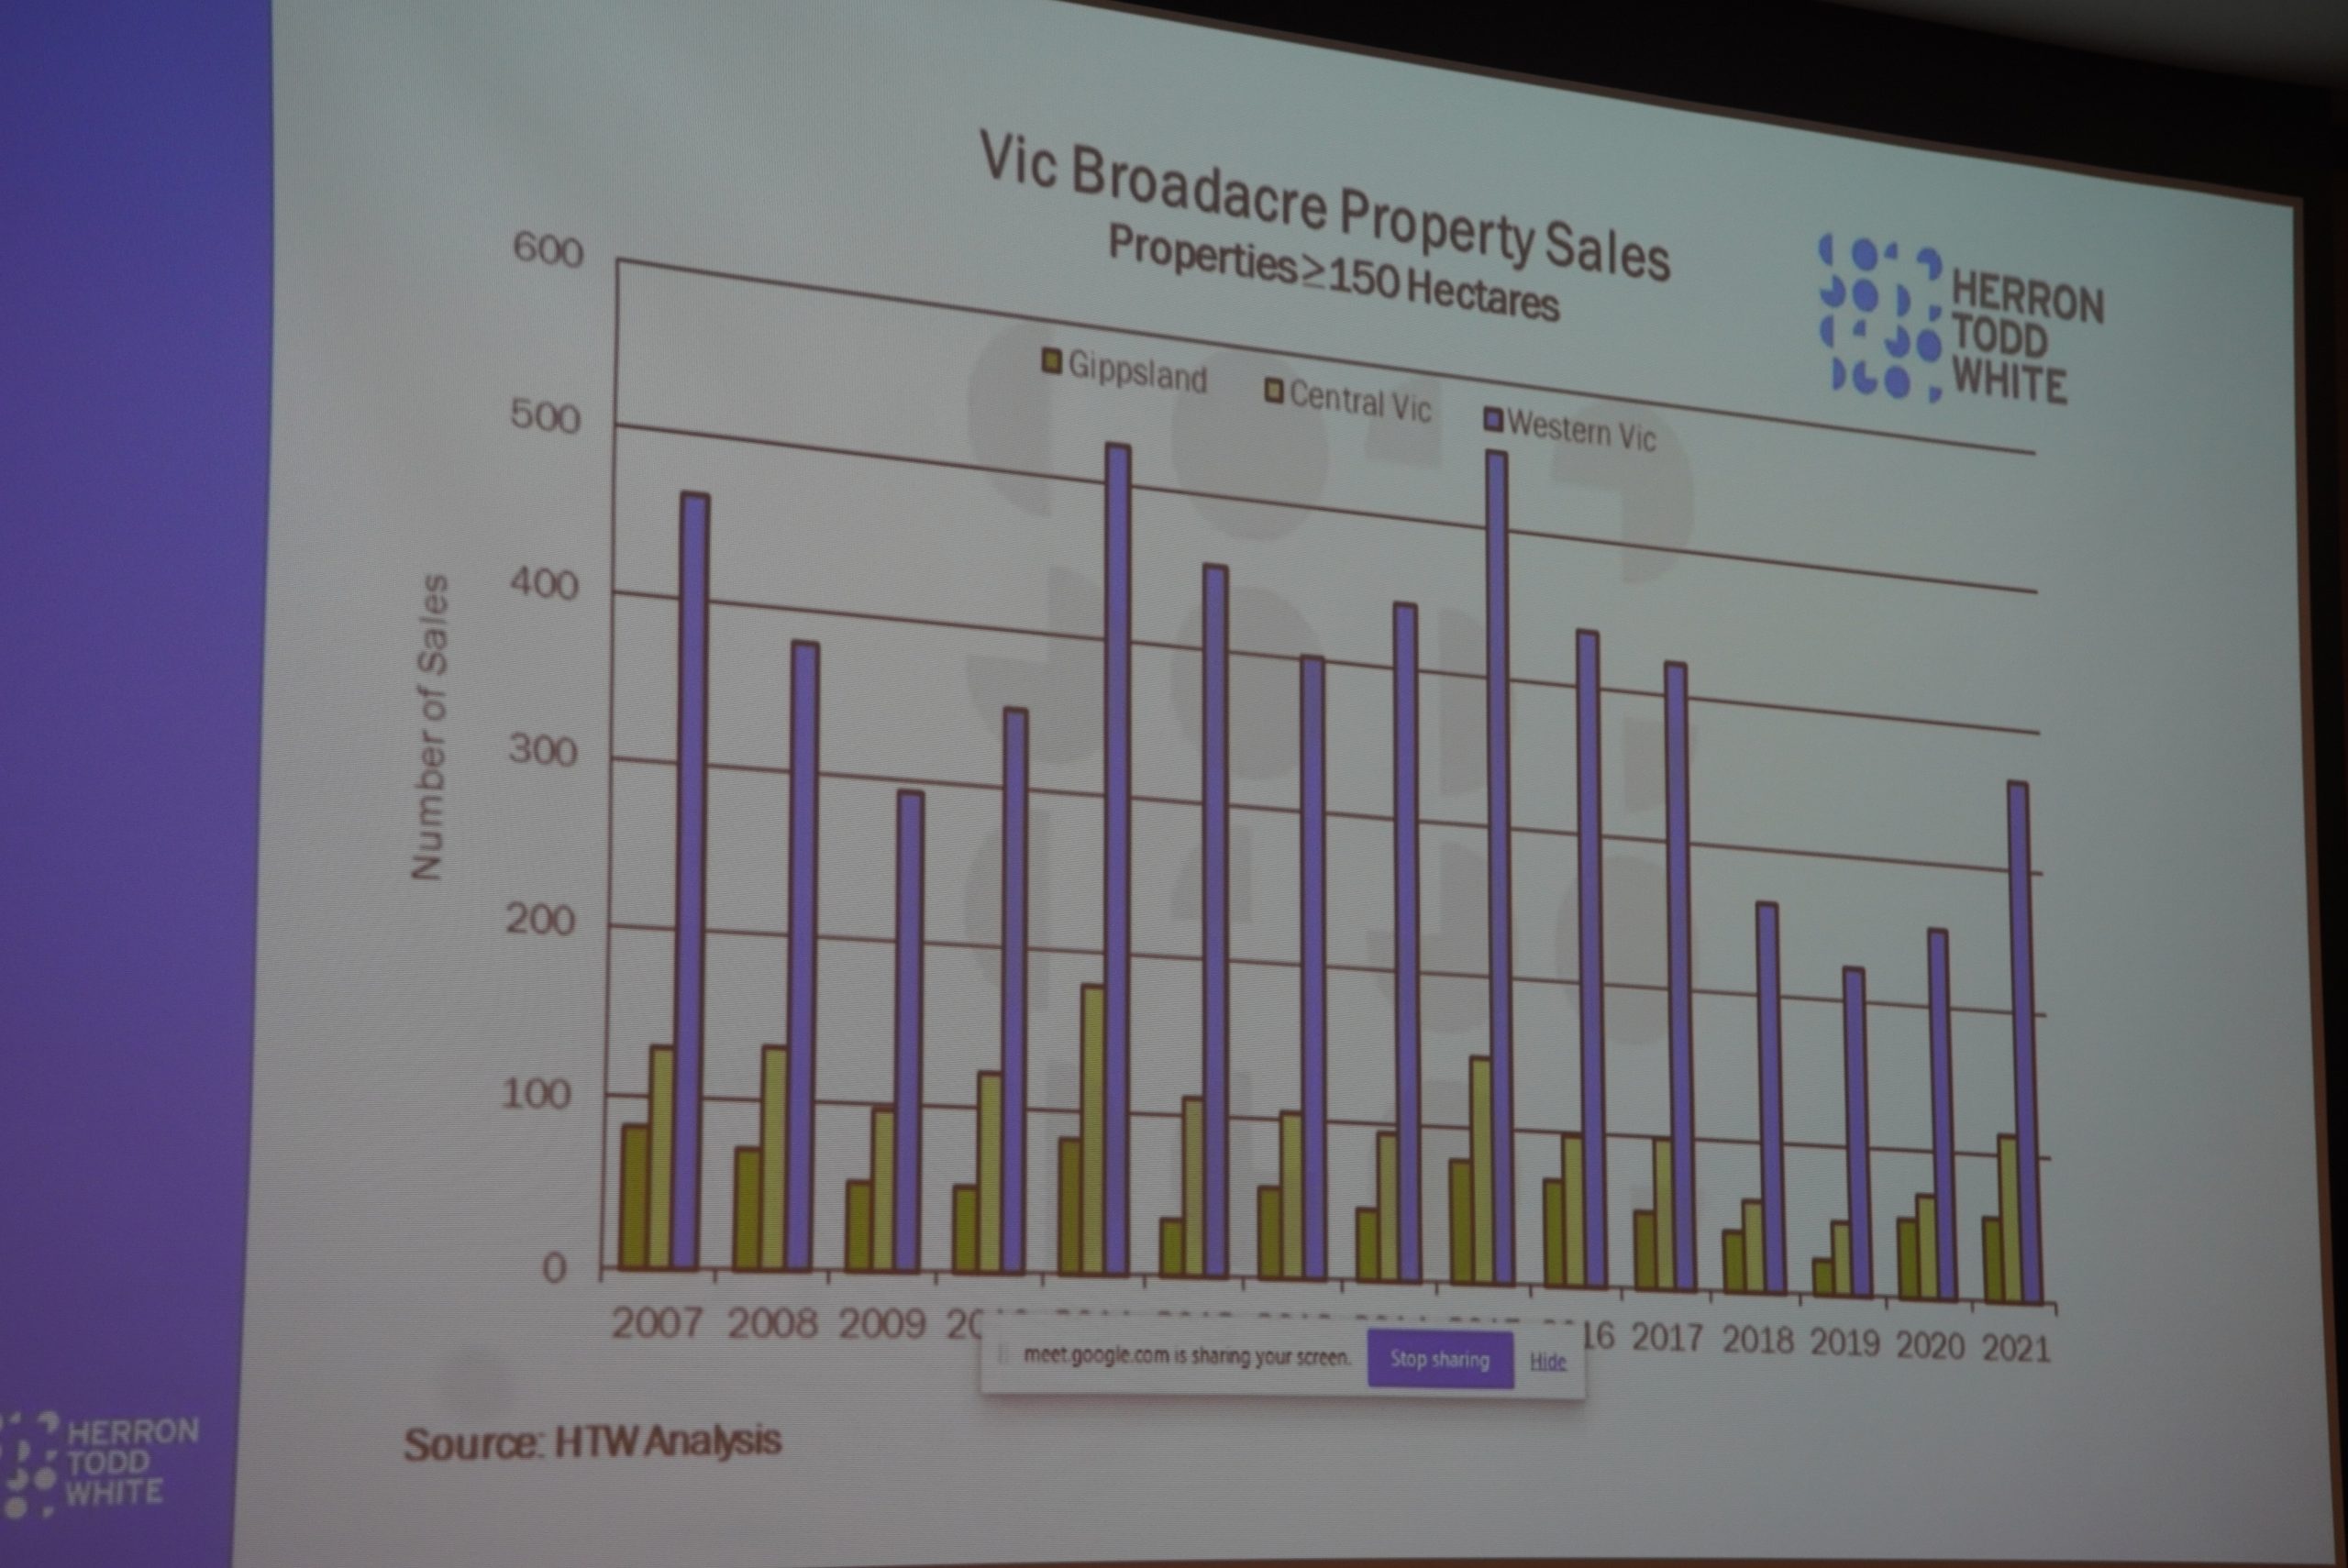
Comparing the number of sales +150ha in Victoria over the last 14 years, sales in the last two years had increased a little, but were still below the trend seen earlier.
“It’s not surprising – the levels of value being achieved in sales today will have shaken-out a few vendors, and there will be some generational change going on. It’s not a bad time to sell, to say the least, so it’s not unexpected that more Victorian properties have come to market.”
As the graph shows, the greatest volume of activity has occurred in western Victoria, especially the Mallee and Wimmera.
NSW
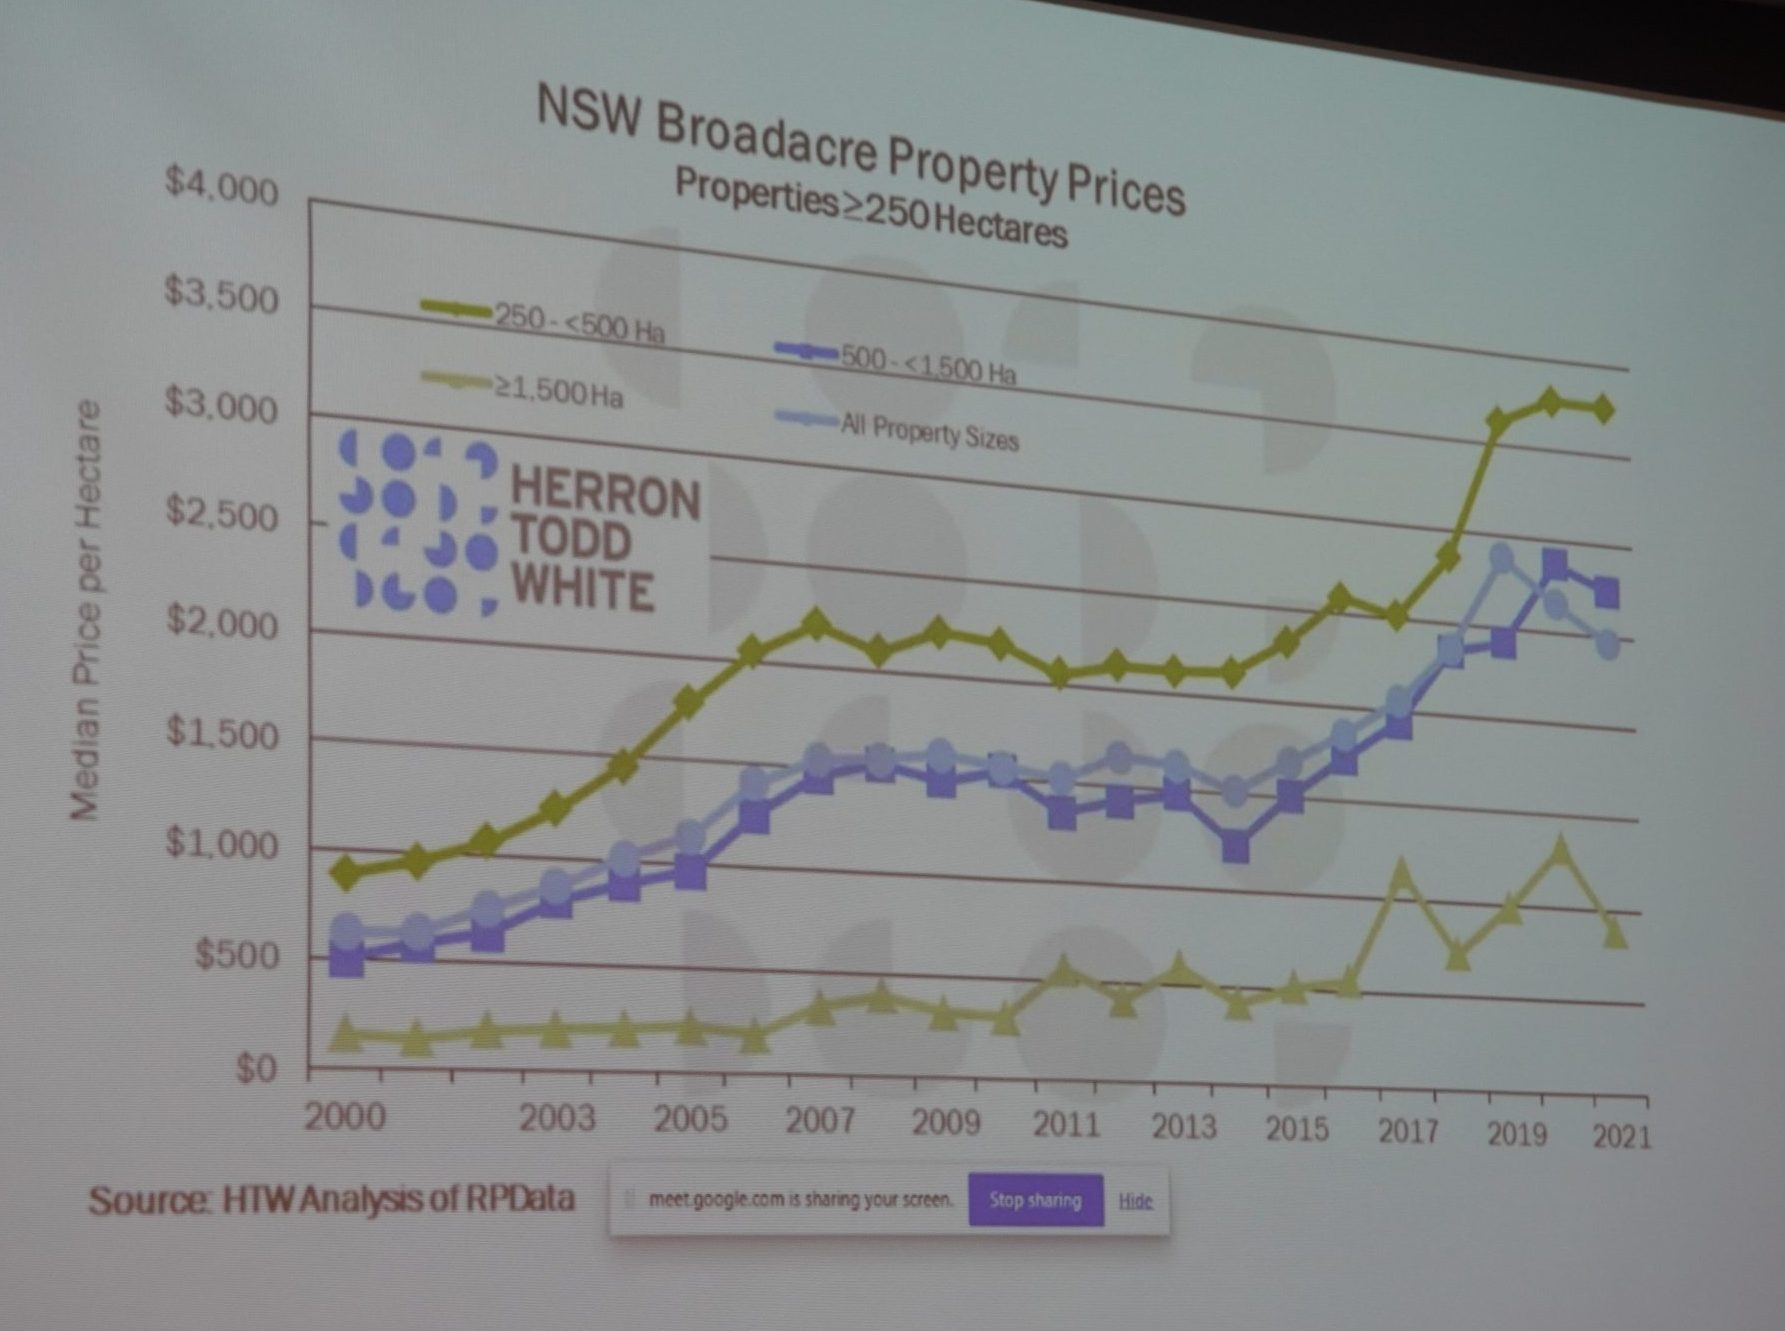
In NSW, results again showed a solid uplift in average price in recent years, although the statistics (and graph below) could be a little misleading, showing the trend levelling off over the past 12 months.
“When we look at the NSW data, the area sold in 2021 was much larger – about 35-40pc more hectares sold than the year before – and a lot of those sales were drier western NSW country, not eastern parts of the state,” Mr Whyte said.
“So statistically, while it looks like the median price has levelled off, we’d suggest it hasn’t – it’s just the higher number of sales of relatively lower value.”
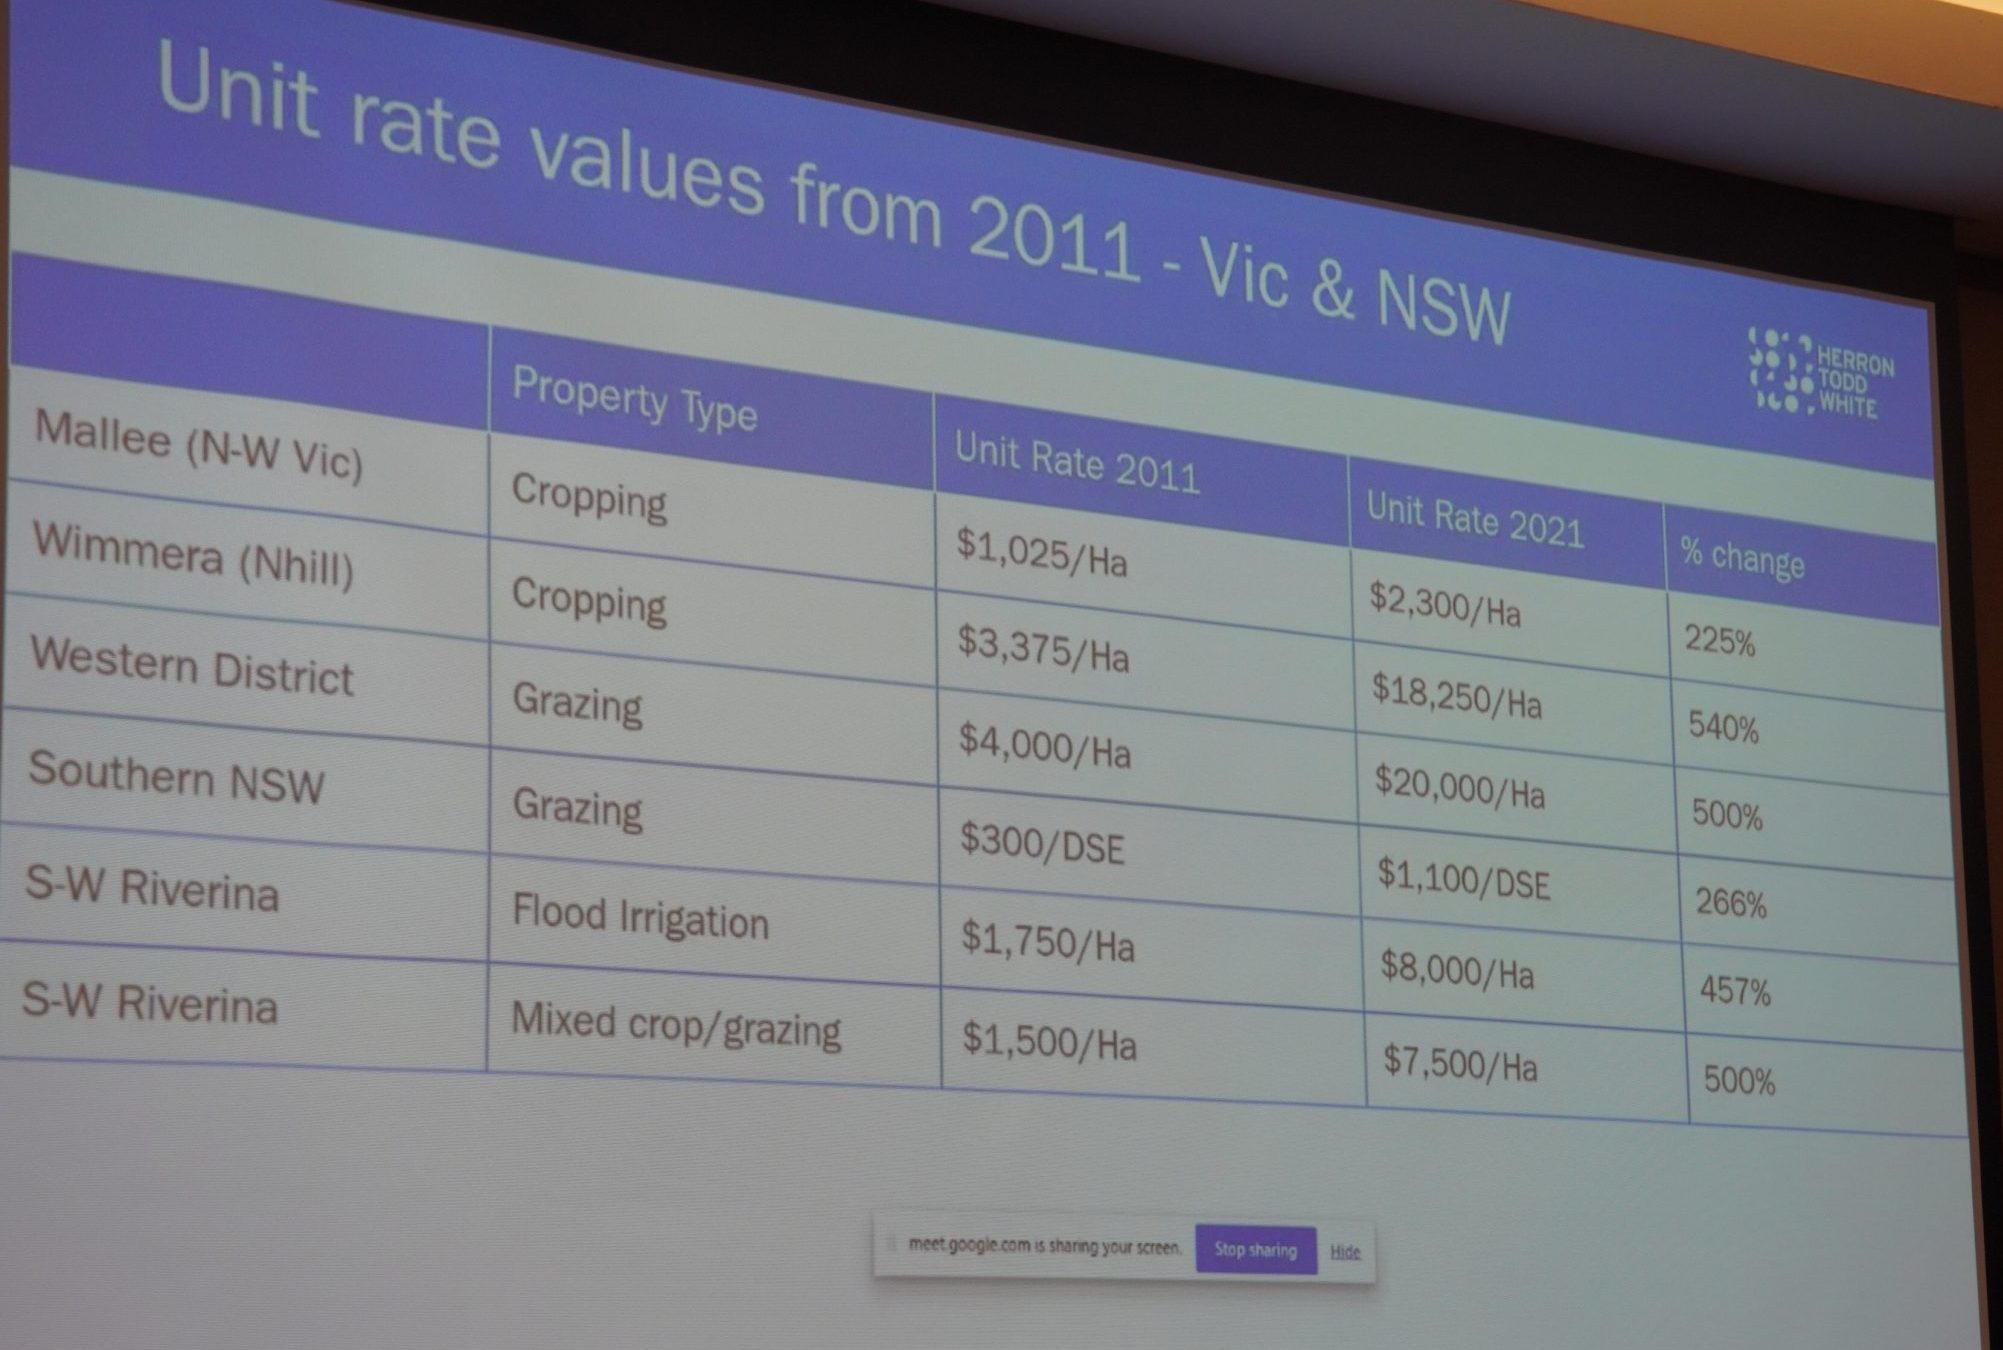
Mr Whyte presented the table below to illustrate changes in unit value since 2011 for various property types in Victoria and NSW.
As the table shows, percentage change in value over the ten years ranged from 225pc for cropping country in the Mallee and 266pc for southern NSW grazing, to 500-540pc for Wimmera cropping, western district (NSW) grazing, and southwest Riverina mixed cropping/grazing.
The really changes had been seen in the more secure rainfall areas, he said.
“It’s quite remarkable what has happened in the southern Riverina and southern NSW over a ten year period, for example. Southern NSW has gone from $300/DSE a decade ago to $1100/DSE now, and farmers are lining up to buy at that rate, knowing they can make money at that level.
Go back 5-10 years, and the Riverina was mostly large-scale irrigation, of rice, dairy farming, with a high reliance on water.
The millennium drought really decimated those industries and that area suffered enormously. Values stayed quite depressed, but people realised that with good soils and reasonable 17-18 inch rainfall, they didn’t ‘have to irrigate.’
“It can become dryland farming or run livestock. So there has been some change of enterprise activity in the region,” Mr Whyte said.
“In the past two years, values have doubled in some instances. But these are not necessarily the great big properties that we see in the headlines,” he said.
“These are largely smaller farms and grazing properties, representing farmer-to-farmer transactions, but highlighting the confidence that farmers and graziers feel at the moment.”
Some were buyers who had bid-up to buy extra country near their home base.
“These sorts of increases are unprecedented in agriculture, I’d suggest,” Mr Whyte said. “We are not used to seeing growth levels at that scale – but we have been.”
Tasmania
The sample size for property transactions +150ha in Tasmania was much smaller than mainland states, meaning results for some years had to be ‘taken with a grain of salt,’ Mr Whyte said.
However, the results showed that northern parts of Tasmania was where most of the transaction action had recently occurred – not a surprising result, when it is considered what type of agriculture goes on in northern Tasmania.