 Every year RCS (Resource Consulting Services) releases the results of its annual profit benchmarking of northern Australian beef industry businesses. The 2017 results, as explained here by RCS general manager David McLean, show that while cost of production is down on last year, so is profit. While this article focuses on data from the northern beef industry, RCS adds that the pattern is reflected across the entire country.
THE 2016-17 Profit Probe benchmarking of the north Australian beef industry showed a decline in the cost of production from the rapidly increasing numbers in previous years.
However, a decrease in turnover and continued increase in land values has put pressure back on Return on Assets (ROA).
Summary of the 2016-17 FY results (compared to 15-16):
- ROA down to average 2.8% (from 4.8%). Top 20% saw a bigger drop to a still respectable 7.3% (from 10.4%)
- Beef price received at farm gate increased to average $3.13 for the year (up from $2.83/kg)
- Cost of production decreased to $1.48/kg on average and $1.10/kg for the Top 20%.
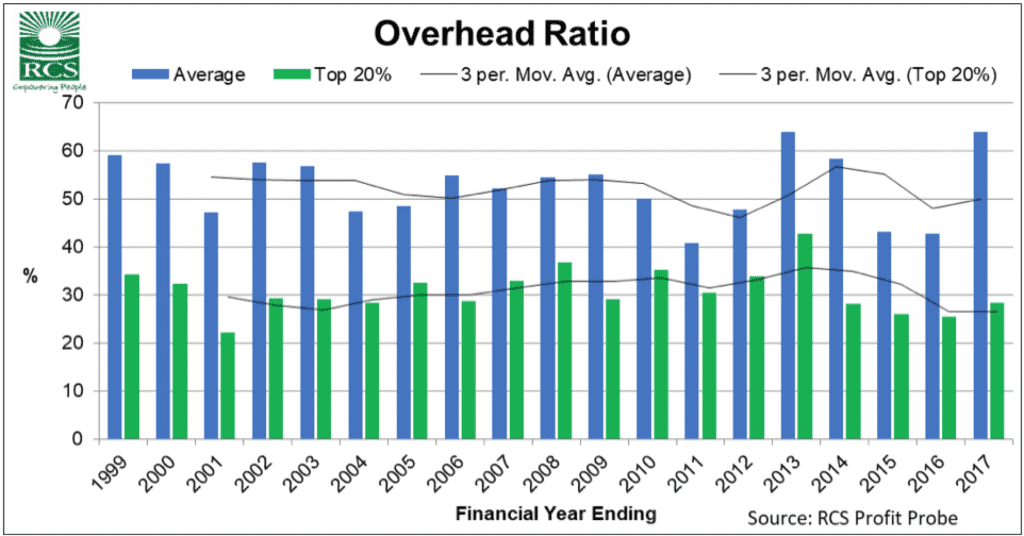
- The average proportion of income going to paying overheads jumped from 42.7% last year to 63.9% this year.
- There is no ‘one size fits all’ approach to increasing your ROA. Individual analysis interpretation of your results is the only way to know where you sit and what your strengths/weaknesses are.
When compared to historical results, the return on assets seen in the past three years are the best seen since the turn of the century.
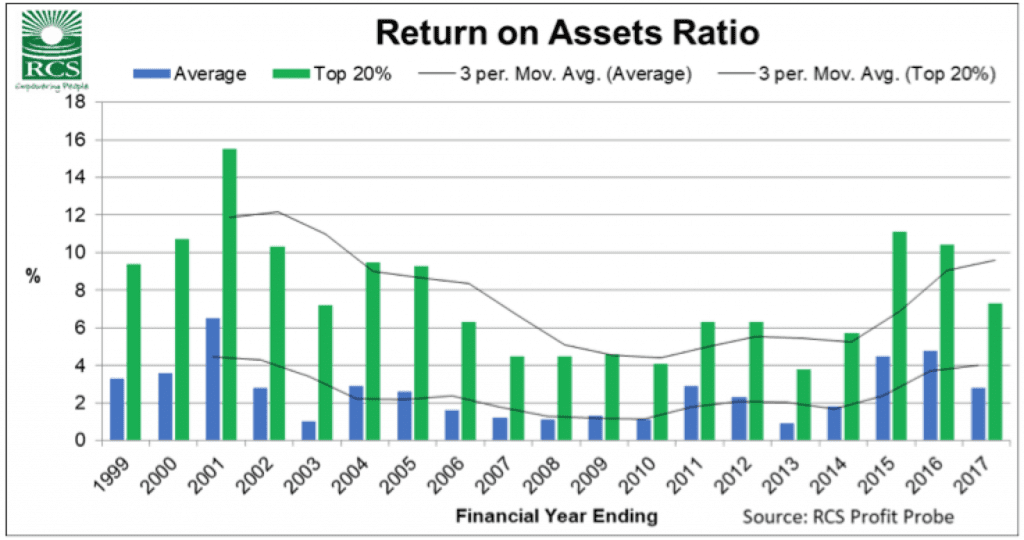
(Click on charts to enlarge)
However, the average ROA was lower than 2004, 2011, 2015 and 2016 when the price received was much less. It is important to note that whilst price received is a driver of potential profit, within any given year, there is no correlation between price received and ROA.
For the 2016-17 FY these two graphs show the price received and cost of production against their ROA outcome.
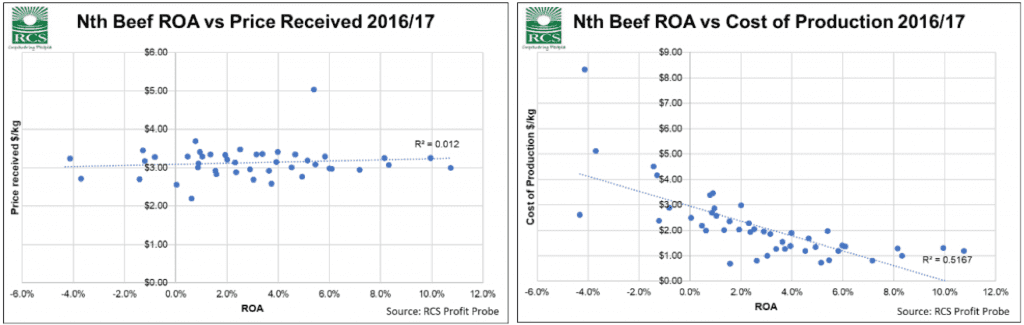
The actual price received did not change for businesses with low or high ROA. However, the ROA clearly increased as the cost of production came down. Hence the ongoing importance of knowing and managing your cost of production. Cost of production is a great KPI (key performance indicator) to use at it reflects our production efficiency and is irrespective of what the market is doing.
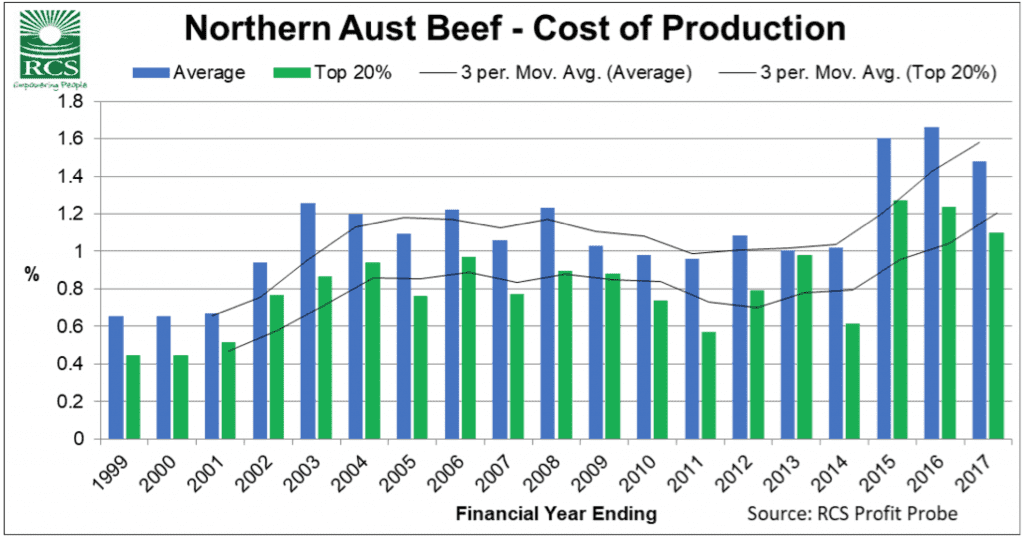
Cost of production decreased to $1.48/kg on average and $1.10/kg for the Top20%. This calculated using total direct + overhead costs divided by gross kg produced. Gross kg considers the change in total herd weight as well as kg sales-purchases. The cost basis is excluding interest, tax, debt reduction and capital expenditure.
The interest cost per kg produced for the same period was an additional $0.36. That means our base survival cost is still up around $1.84/kg (1.48+0.36). Let’s not forget that the EYCI dropped 150c in the four months to October this year. We cannot predict the market so knowing and managing your cost of production to keep your operating margins high is the only protection you have to market variations.
In all the consults the RCS Team have done recently using Profit Probe results, the actions for each business are different. There is not silver bullet or one size fits all. It is necessary to analyse and interpret your own results to know where to focus in 2018.
It is worth sharing what the overhead ratio has done this year. Reducing the overhead ratio is one of the RCS ‘3 Secrets of Profit’ along with increasing turnover and gross margin ratios. The 2014-15 and 2015-16 overhead ratios looked much better on average (see blue columns below), largely due to increase in cattle market. Without as big an increase in the cattle market this year, the ratio of money spent on overheads vs gross product has jumped back over 60% again. Average overheads per LSU managed haven’t shifted much ($122/LSU) however gross product has declined putting more pressure on the key ratios, including turnover.
This brings us to the expense ratio (aka the quick and dirty ratio). The expense ratio shows us, in economic terms (i.e. using cash and non-cash income and expense items), what is left after paying for direct costs, overhead costs and interest.
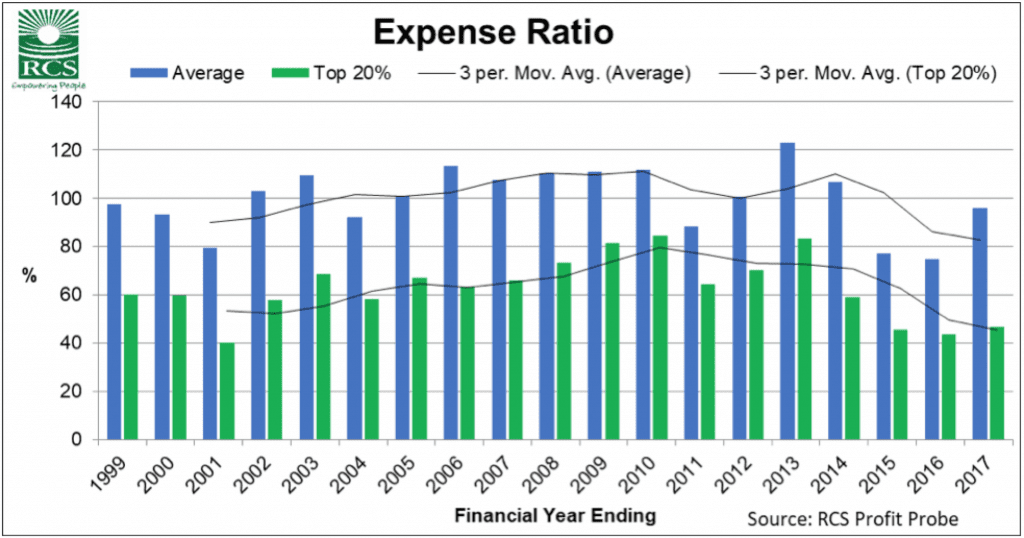
The outcome of all this? The Top20% of business are still making a healthy profit in 2016-17 with ROA at 7.3% and an expense ratio of 46.8%. On average, the ROA dropped to 2.8% and the expense ratio jumped to 96.2%. This tells us that in economic terms, the average beef producer earned more than they spent – just.
Once it goes over 100% again (as it has been for most of the past decade) we are spending more than we are earning. When this happens, we are subsidising the business by not paying market cost of labour, not keeping our R&M up to date or increasing our borrowings.
I recommend you check your strategies. Use these high prices to invest in the business to either increase production or decrease running costs moving forward. If money invested isn’t doing one of these two things it could just be increasing your cost of production in future years!
It isn’t too late to benchmark your business via Profit Probe and know exactly where you sit.