 Minimising the potential downsides to risk exposure, and taking opportunities when they arise were two distinguishing features which set the top 20pc of performers apart from the pack in RCS’s latest ProfitProbe farming business performance analysis released this week. Measured by return on assets, the top 20pc of operators achieved a 5.7pc ROA for the financial year, with the average ROA for all businesses who completed benchmarking 1.8pc. Here’s RCS chairman David McLean’s summary…
THE 2018/19 financial year will go down as one of the driest and hottest in recent memory – and the first half of 19/20 isn’t showing many signs of change.
Variability is ingrained into agricultural life. The timing, amount and distribution of rainfall has presented both extreme management challenges and opportunities.
Cattle prices experienced volatility, with a quick drop due to excess supply around March, however they recovered to finish the financial year pretty well where it started.
The sheep industry saw meat prices rapidly increase to record prices during the year, opposite to what the wool market did – although in historical terms, the wool market remains very strong.
Grains and pulses remained very strong due to low supply and high demand for both processing and stock feed.
So, after putting all this into the mixing bowl, just what recipe provided the best economic results in the latest ProfitProbe data?
There is no recipe, not in the way that many people wish there was. The most profitable businesses as measured by ProfitProbe had characteristics that many salesmen would consider quite boring. What they did was manage their costs and optimise their productivity in the conditions they were dealt.
The Top 20pc of businesses (measured by return on assets, ROA) were in a combination of sectors (cattle, sheep and cropping). They were dryland and irrigation; breeding, growing and trading; and had a range of breeds/varieties. Our ProfitProbe benchmarking (backed up the analysis the RCS Team does during on-farm consults) consistently showed that it isn’t what you do, it is the decisions made around what you do and how well you do ‘it’.
Key factors among better performers
Looking into the data of the businesses that did get into the Top 20pc this year, I did notice two key factors.
They minimised the potential downsides to their risk exposure. In other words, they were happy to take theoretically ‘smaller’ profits in order to reduce the risk of bigger losses. This reminds me of a saying I heard years ago, “You can’t go broke making a profit.”
While the opportunities were out there if the coin toss landed on heads, the risk surrounding it landing on tails was too great, so decisions were made to manage this. For example, selling animals earlier at lighter weights, early weaning and reducing numbers early, growing crops with theoretically lower gross margins however needed much less moisture to generate that margin etc.
The better performers took opportunities when they arose. For example, they took on short-term livestock trades, watched the market and looked for prospects to take a profit and reduce risk at the same time. They utilised their networks and nurtured partnerships to create better outcomes (compared to businesses which went with the flow).
They did the basic stuff pretty well, kept looking ahead (a.k.a. planning) and didn’t panic. Now this isn’t sexy, so you won’t hear it talked about much, however it is really powerful. To be honest, if we spent less time on the sexy stuff (putting on kgs/maximising yield) and more time on fundamental decisions that increase margins (income minus costs) the whole industry would be better off.
Onto the ProfitProbe benchmarking results for this year.
ProfitProbe is a detailed process of economic benchmarking, where the cash and non-cash components of running a business are included in the analysis.
Depreciation of vehicles etc, is the most well-known non-cash cost that is used.
We also include unpaid labour (non-cash: the real cost of labour used to run the business if you paid everyone a market wage for work that needed to be done) and exclude drawings (the cash you draw out for that work that was done).
The final and biggest component is change in inventory. This is where we account for the movements in the number and value of your livestock or crops in silos through the year (using your stockflow and cropflow documents).
For livestock, the breeding females open and close the year at the same value. The trading/growing animals however are valued at market value (we use MLA market indicators such as EYCI/ETLI as a base valuation to indicate trend). As mentioned, cattle remained static however sheep increased considerably.
The Top 20pc benchmarks quoted in this report are the results achieved by the top 20pc businesses as ranked by the highest return on asset (ROA) – i.e. what are the characteristics of the most profitable businesses.
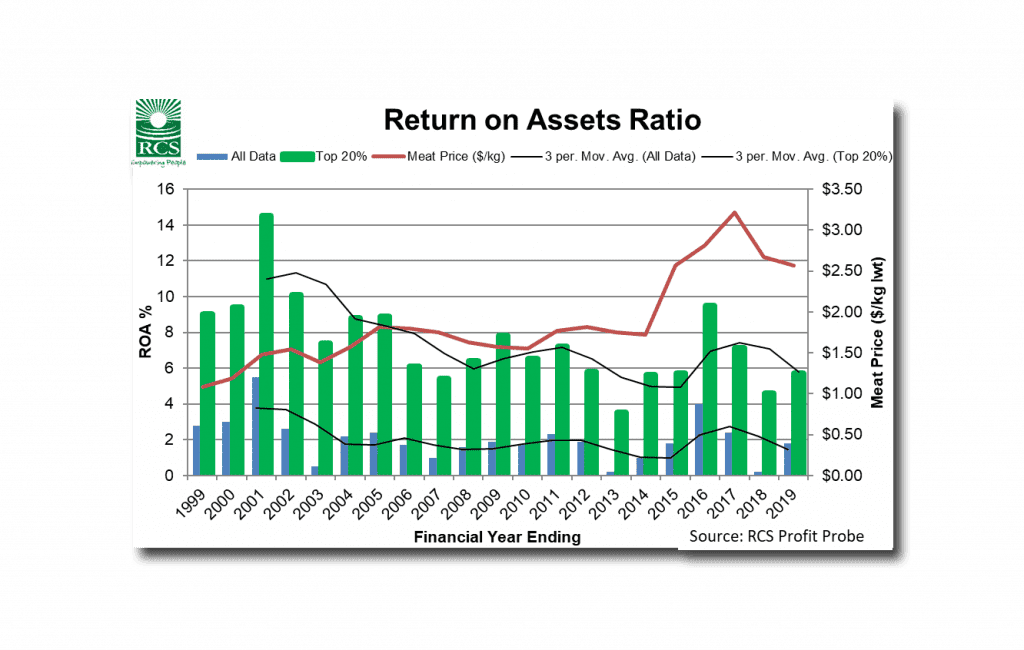
Return On Assets
The Top 20pc achieved a 5.7pc ROA for the financial year with the average ROA for all businesses who completed benchmarking 1.8pc. Returns from increase in land value are additional to this return, so when combined, you could surmise that overall returns are better than bank interest in the current economy.
Click on graph images for a larger view
The three-year ROA results from this year are very similar to what we saw ten years ago. For cattle and sheep businesses there is one distinct difference – the cattle market has risen nearly 50pc since then. What is driving this?
- Drought? Logically, I feel as though it is having an impact, however the benchmark data isn’t showing any significant change in kg/ha or kg per animal unit. Even when I dig down into more region-specific data, the average productivity is similar for the past 10 years. This surprises me!
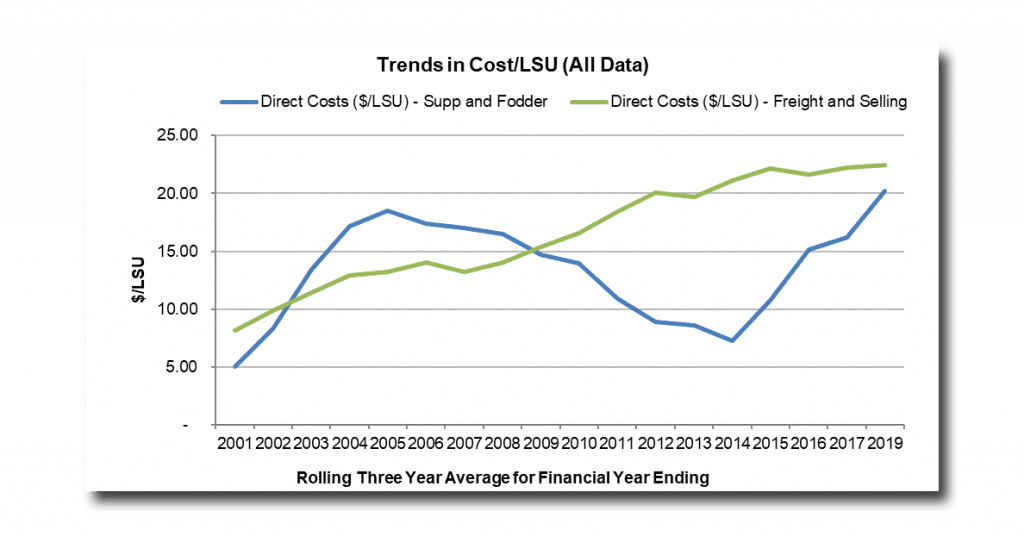
- Increased direct and overhead costs? Yes, this has increased in two ways. Both the unit cost to purchase key inputs and the amount of inputs used. I was interested to see this graph showing the trends for livestock businesses in supplement/fodder costs and freight and selling. Freight and selling costs on a per animal unit basis have increased year on year. Supplement and fodder started to increase in 2013/14. Was this initially due to the increase in beef price and so more focus on productivity, now more on drought supplementation/substitution? This could explain the consistent production rates. This graph looks at the three-year average (to take out some of the seasonal variation).
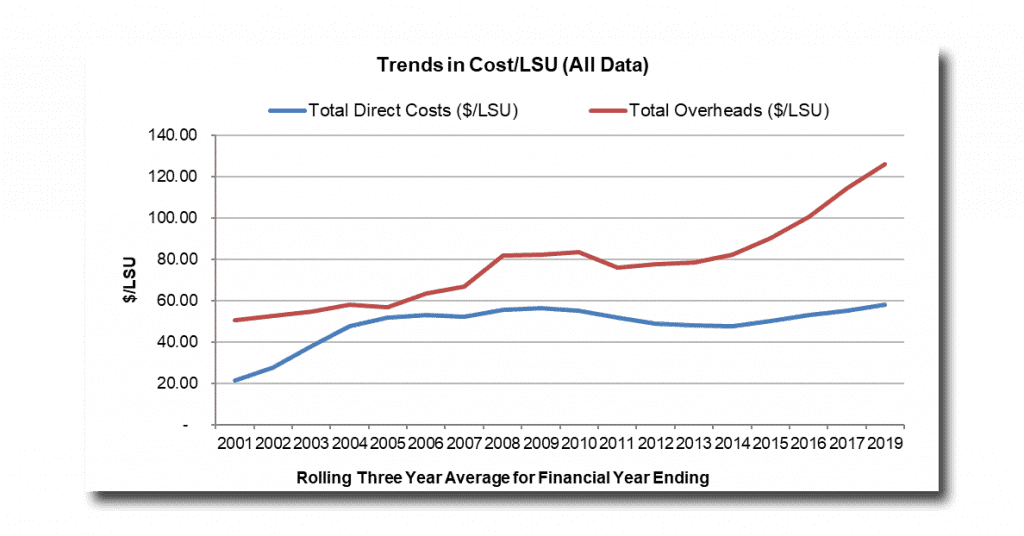
Overall, the direct costs per animal unit have flattened out in the past ten years, as seen below. The overhead costs on the other hand continue to increase at a concerning rate.
A thought has been churning away in my head regarding this ROA trend. Is the limiting factor to what ROA a business can achieve a mental/attitude limitation and not a business/industry/market limitation? Are business owners reaching their minimum desired profit levels and then starting to coast along in the ‘comfort zone’?
I look at what my parents were able to achieve in educating three boys through boarding school (an amazing feat) and feel as though when the goal and timeframe are clear enough, people ‘find’ ways to produce the profits that achieve the desired goals. When the ‘need’ to achieve certain profitability isn’t as clear, do the motives and drive for profit change? So, is the limitation a lack of true ownership of clear goals? Time will tell.
The Three Secrets of Profit
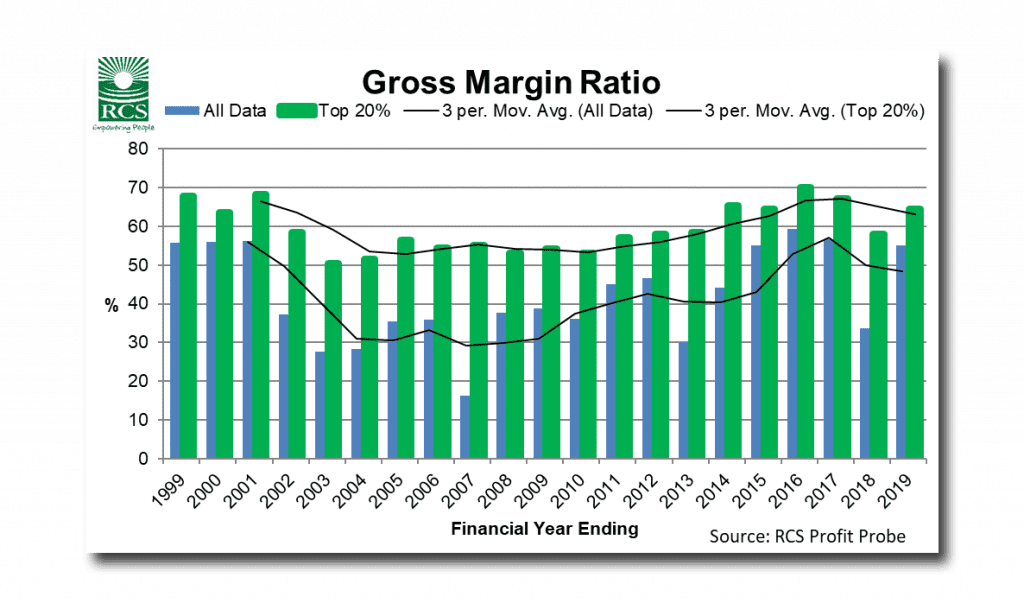
The gross margin ratio indicates how much gross product (cash and non-cash income) is left after paying for direct costs. This year’s Top 20pc, at 64pc, are right on what I feel is a good target (greater than 65pc) whilst the average result came up to 55pc. Overall a much stronger result compared to last year.
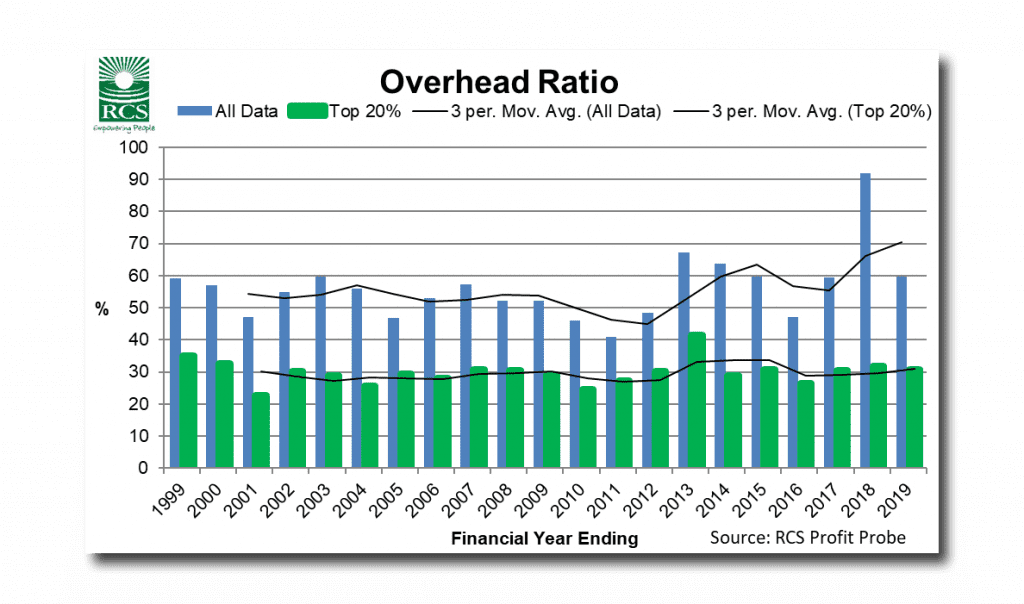
The overhead ratio indicates how much gross product goes towards paying for our overhead costs in the business. Those businesses achieving the highest ROA each year have either been able to manage their total overhead costs and/or been able to dilute these costs by higher relative gross product. The overhead ratio for the top 20pc was 31pc compared to an average of 60pc. The target is under 35pc.
The relationship between this metric and profit is clear, as shown by the consistent gap between the Top 20pc and average results below. If a metric isn’t consistently a driver of profit, you see the Top 20pc and average results closer together with no clear difference between them.
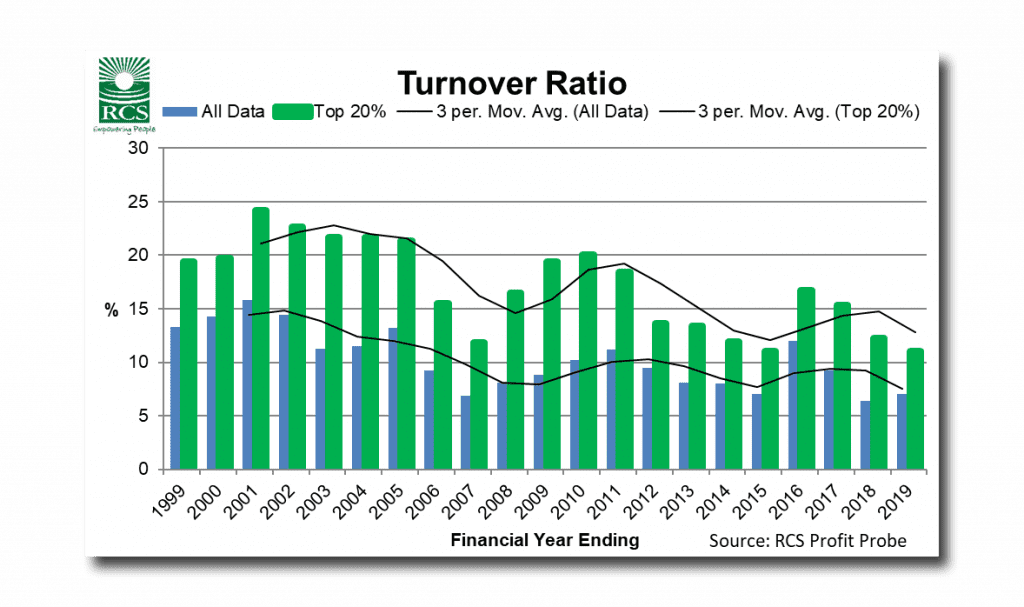
Turnover continues to come under pressure. The turnover ratio indicates how active our assets are by comparing total gross product to the total agricultural assets under management. Increasing land value is the primary reason for this trend. The Top 20pc turnover ratio was 11pc and the average result was 7pc. Historically the target here has been greater than 15pc, however I feel the target now is greater than 13pc. Some options to increase turnover are: increase yields, lease/share farm/agist, relocate, stack enterprises, enterprise change/improvement. Any changes must be profitable with consideration given to gross margin and overhead ratios and overall cost of production.
COP, Expense Ratio and Gross Product/FTE
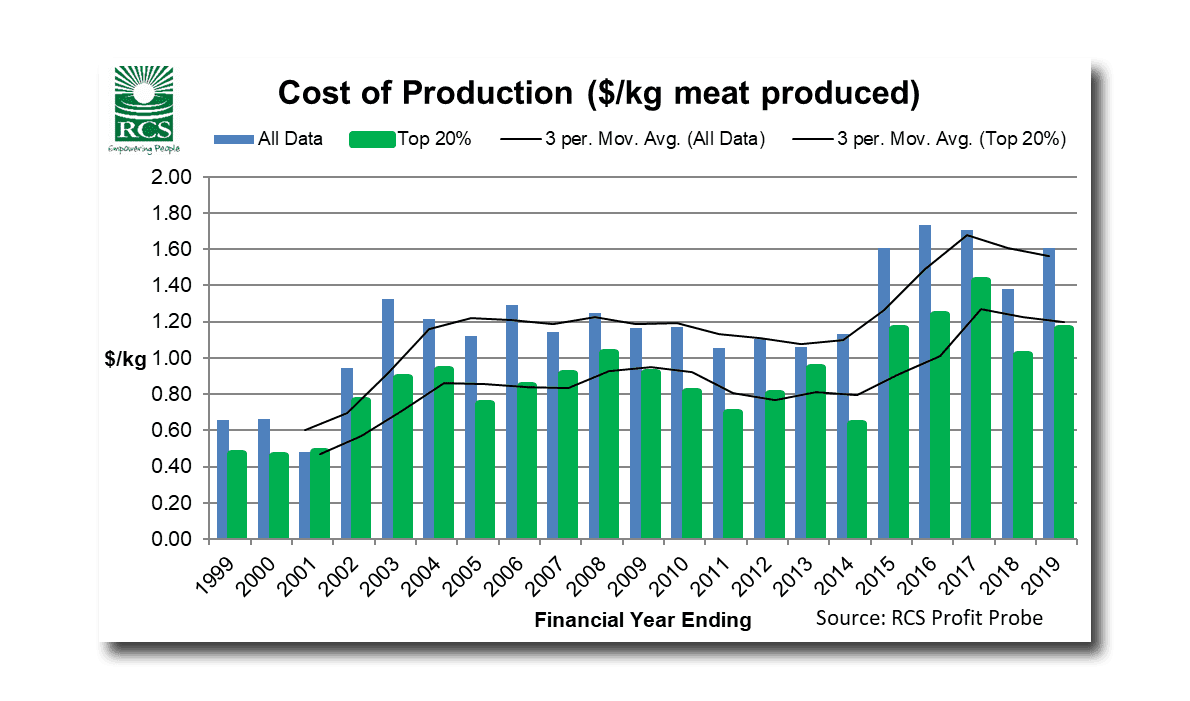
If you want to analyse your business without the un-controllable influences of market prices, then cost of production (COP) remains the best number in my opinion. The drop in COP last financial year wasn’t repeated this year and the Top 20pc COP increased to $1.16/kg compared to the average of $1.61/kg. These results only include direct costs and overhead costs to run the business and exclude interest.
COP is an indicator of our ability to withstand market variation. Financial success doesn’t come from how much we produce, what we get paid or how miserly we are. It comes from the difference between what the market pays us and the COP (costs divided by production).
If you went through your business and considered every cost line item as an investment, what return on investment are you getting from each one? Could it be better? Have you looked to see what the trends are in your business across time?
I am concerned about the $1.61/kg average, as it simply doesn’t provide a big enough margin to achieve most businesses goals (e.g. growth, expansion, re-investment, other investments, debt reduction, succession, management transition etc).
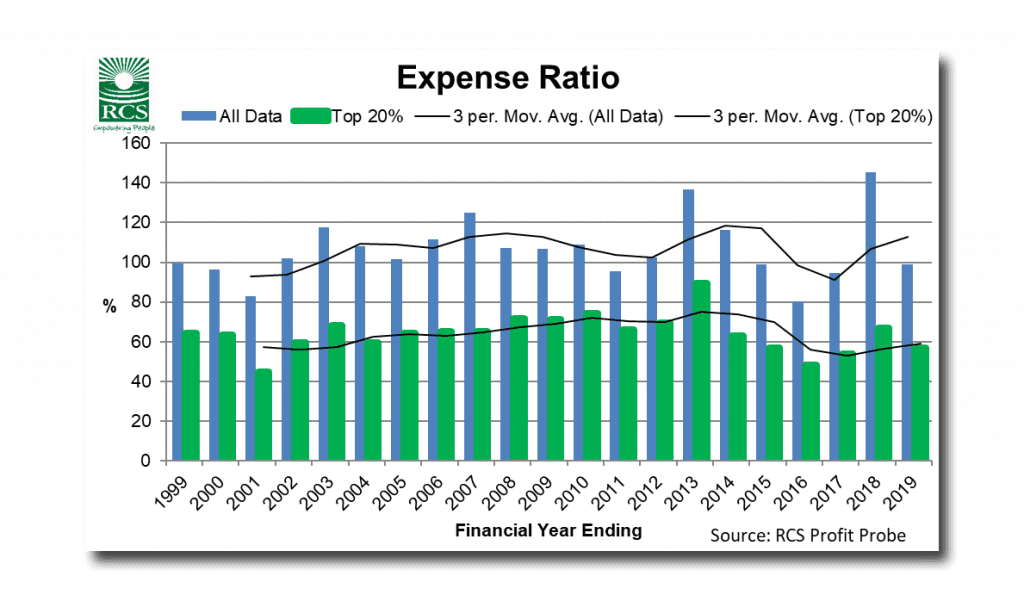
The expense ratio is the relationship between the economic value of production (gross product) and the total costs (direct costs + overhead costs + interest costs). If this figure is over 100pc then we’ve spent more than we’ve earned. In economic terms, the average producer was over 100pc for most of the 2000’s. The increase in inventory values diluted the results for a few years from 2014/15 to 2016/17. However, the increase in COP since 2014/15 has seen the expense ratio explode last financial year to now settle back at 99pc on average and 57pc for the Top 20pc producers.
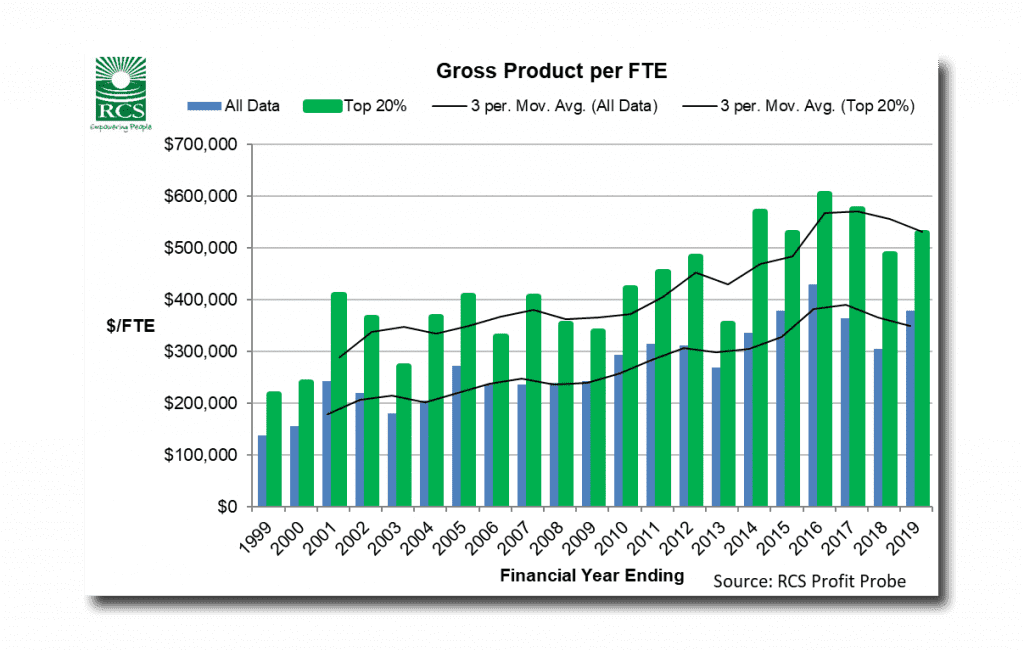
The final benchmark data included in this year’s report is gross product generated per full time equivalent (FTE) labour unit. I prefer this KPI as an indicator of labour efficiency (compared to hectares farmed and LSU or DSE per FTE), as it focuses on the economic value contributed by each labour unit.
High labour input operations are okay if they generate the income needed to validate their work. The Top 20pc businesses are now achieving a GP of over $500,000 per FTE. Comparatively, the average result is now generating about $350,000 GP/FTE which was the benchmark result for high performing operations 10 years ago.
Where to from here?
I interpret these results as presenting some great opportunities for those operators who know what is going on in their business and who are ready to take advantage of these opportunities when they present themselves.
This is what I’d do:
- Firstly, know what the numbers are for your business. There is no silver bullet, and you need to know your current reality. It isn’t too late to analyse your business via ProfitProbe.
- If you’ve already done that, then make sure you know what the key numbers are that you need to focus on (use the help videos and documents available plus your advisor). What are your strengths and weaknesses (we all have them)? Build on those strengths and address your weaknesses. Don’t look at these numbers above and think they apply directly to your business. Know where your deadwood is and cut it out.
- Ask yourself what return on investment you get from each of your costs. Have any unnecessary costs crept in? If you had to, or wanted to, what costs could be cut out?
- What does this year look like? If you had an enterprise that made a loss last year, is it going to do it again? If it is, then what are you going to do about it?
- What will prices and seasons do in the future? Nobody can predict this. My suggestion is that you consider your business operating model with respect to each enterprises’ ability to be profitable with the assumption of large variability.
![]() To discuss benchmarking and analysing you business, readers can contact RCS:
To discuss benchmarking and analysing you business, readers can contact RCS:
Phone: 1800 356 004
Email click here
Website click here.
Source: RCS