 A monthly column written exclusively for Beef Central by Steve Kay, editor of US Cattle Buyers Weekly
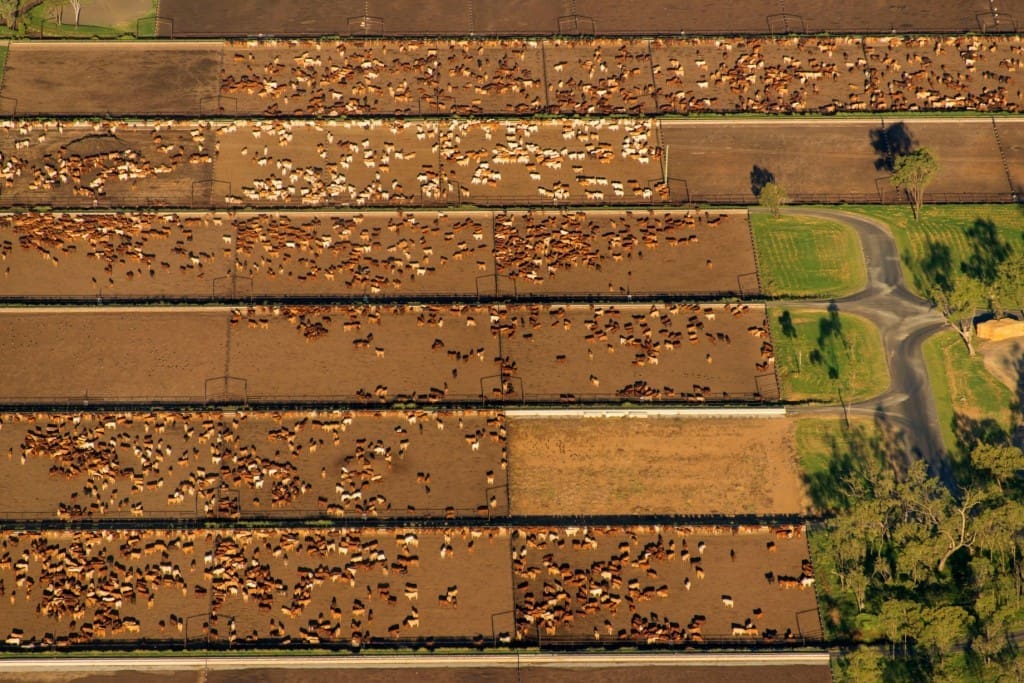
THE United States, Canada and Australia are arguably the top three countries in the number of cattle they feed in confinement yards on a largely grain-based diet.
This appears to make them the world’s largest producers of grainfed cattle and beef.
I say ‘arguably’, because Brazil is putting more cattle in feedlots each year. One estimate says Brazil might soon have 4.5 million cattle in feedlots.
But how long they spend in the yard, and what they eat is different to cattle lotfeeding systems in North America and Australia.
As for other countries with feedlot sectors, a search on the Web for feedlot numbers in Argentina and South Africa reveals an unfortunate lack of information. Brazilian beef giant Marfrig appears to be expanding its feedlot presence in Argentina and the country might soon have pen space for several hundred thousand head.
South Africa has one 120,000 head feedlot owned by Karan Beef, and Chalmar Beef (Willam Westmar spoke at last year’s BeefEx conference) feeds about 20,000 head. A few other lots are only in the 6000 head range.
This leaves the US far ahead of any other country in terms of feeding capacity. Its 10.782 million head on feed on February 1 was more than eleven times the number on feed in Australia (960,000 head) in January and in Canada (919,000 head) on February 1.
Both countries, though, have had close to, or just over one million cattle on feed on occasion. Canada’s feeding industry is larger, though, than Australia’s, as the numbers I cite are only for feedlots in Alberta and Saskatchewan. These two provinces account for 70pc of all of Canada’s fed cattle marketings.
One can thus assume that Canada nationally had about 1.2 million cattle in feedlots at the start of February.
Numbers on feed in Australia and Canada fluctuate significantly. As Beef Central readers well know, Australian numbers at times decline into the 700,000’s. In recent months, they have gone from 790,000 head to 960,000 head in January, close to the record set in December 2015.
Canada had a record 1.5 million cattle on feed in 1999 when a survey of feedlots began. Numbers fell to only 832,000 head last October, because of a delay in placements, then increased. But the Feb 1 number was still down 9pc on the year before.
Cattle on feed totals in the US have also seen quite large fluctuations due to the effects of extreme drought, then herd rebuilding (with fewer heifers going on feed). Numbers spiked up to more than 12 million head at the end of 2011 after drought forced a lot of young animals into feedlots. The numbers fell just below 10 million head on August 1 2014, but have gradually increased to their current level, which is just above a year ago.
Fluctuation brings myriad challenges
Fluctuation in numbers on feed in all three countries has produced a myriad of challenges for cattle feeders. Fluctuating prices for feedgrains and for young cattle and finished cattle have at times made cattle feeding akin to playing the tables in Las Vegas.
It’s remarkable then that one hears, at least in the US, of few feedlot closures. Such actions seldom make news anyway, unlike closures of beef processing plants. But as many as ten mid-sized feedlots quietly closed in 2016, according to latest USDA data. In contrast, the industry gained two more feedlots in the largest category and 2000 more feedlots in the smallest category.
Both increases were in line with industry trends of recent years. The largest feedlots have the economies of scale and financial resources to best withstand the severe swings in US (and equally, Australian) cattle feeding profits that have occurred in recent years.
Meanwhile, the relatively low price of corn has encouraged more US ‘farmer-feeders’ to feed cattle to ‘walk the corn’ off their farms. Largest feedlot operations still dominate the sector however. The 73 feedlots in the US with 50,000 head of capacity or larger (up from 71 in 2015) marketed 8.25 million head in 2016, 34.4pc of the total number of cattle marketed last year.
USDA’s February Cattle on Feed report revealed that the only decline in the number of feedlots came in the three groups with 16,000 to 49,999 head of capacity. Their combined number declined by 12 lots from 2015.
The 16,000-23,999 head group lost seven feedlots; the 24,000-31,999 head group lost three; and the 32,000-49,999 head group lost two. But these two likely moved up into the 50,000 head and over group, while some of the 16,000 to 23,999 head group might have downsized.
The report showed that the number of US feedlots with less than 1000 head of capacity (not included in USDA’s monthly COF reports) increased to 28,000 lots in 2016 from 26,000 in 2015. They marketed 3.1 million head in 2016 versus 2.895 million in 2015. But their COF inventory as of Jan 1 this year was 2.46 million head, down from 2.58 million head a year earlier.
The increase in the number of the smallest feedlots meant the total number of feed yards in the US on January 1 this year was 30,219, versus 28,189 a year earlier. The yards with capacity under 1000 head accounted for 93pc of the total, but they marketed only 12.9pc of all US grainfed cattle in 2016.
US feedlot utilisation low
The report also revealed that the total capacity of feedlots 1000 head and larger on January 1 was 17.3 million head, up from 17.1 million in January last year, and in 2015. This meant that the 10.78 million head on feed on February 1 filled only 62.3pc of the yards’ capacity.
USDA’s report also contained two important new heaviest weight categories of placements, which will help the industry better forecast how many finished cattle are due to come to market at a certain time.
Heavy feedlot placements have increased significantly in recent years, notes Oklahoma State University’s Derrell Peel. Prior to 2012, the annual percent of heavy placements each month was fairly constant at about 28pc. Starting then, the proportion increased steadily to the 2016 average of 36.85pc.
Not knowing how weights were distributed above 800 pounds carcase weight (+364kg) made it difficult to anticipate the market timing of heavy placements, he says.