A recent update to WildDogScan now provides a national picture of wild dog activity across Australia highlighting hotspots of movement and management.
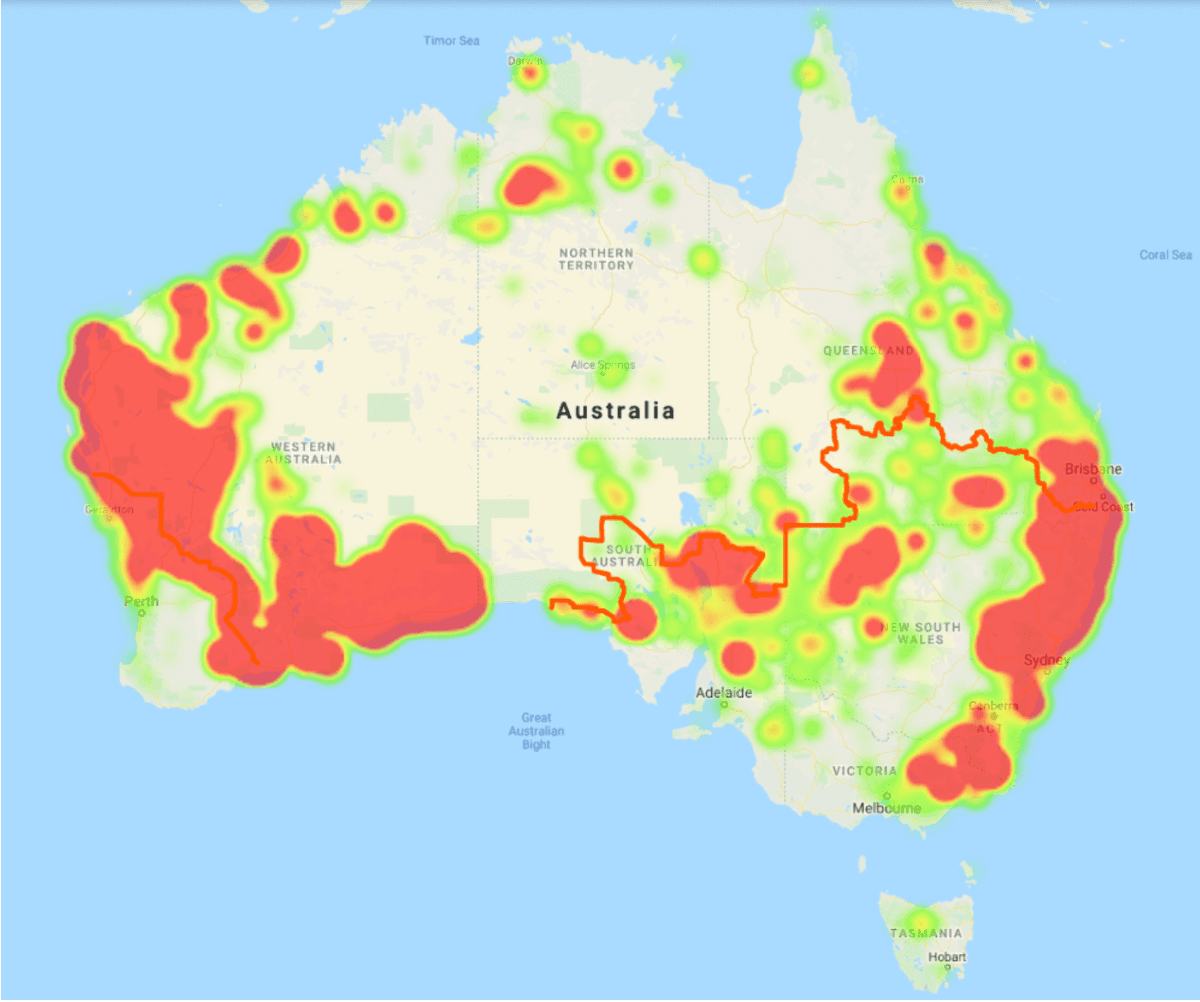
Drawing on more than 134,000 records of wild dog sightings, attacks and control activities uploaded to the platform since its launch in 2011, WildDogScan allows users to view the data as a heat map.
The new WildDogScan heat map displays areas where wild dogs are causing damage, and the areas where communities and local authorities are managing them.
National WildDogScan coordinator Peter West said this was the first time data on wild dog activity had been visually represented at a national scale in this way.
“In time we hope to build in increased functionality, such as the option for users to create time series maps and display the heat map at a state and territory level,” Mr West said.
“We are conscious of farmer privacy and the security of the data they upload to the platform – this will inform how we display the data into the future.”
More than 250 landholder groups have registered on the platform, allowing their members to monitor wild dog activity, stay informed of changes in wild dog activity, and connect with support organisations.
Source: Wild Dog National Action Plan. For more information visit the WildDogScan website here.