DROUGHT has had an inevitable impact on Meat Standards Australia eating quality index performance in 2018-19, however the longer-term trend remains up.
The national average MSA Index figure last financial year was 57.62, down from about 57.75 the year before, but still improving 0.73 index points since 2010-11.
The impact of drought on growth rates and finishing ability had an inevitable impact on index performance this year.
The results are revealed in the 2019 Australian Beef Eating Quality Insights (ABEQI) produced by Meat & Livestock Australia. The report aims to help beef producers optimise the eating quality of cattle by demonstrating the impact production factors have on carcase performance.
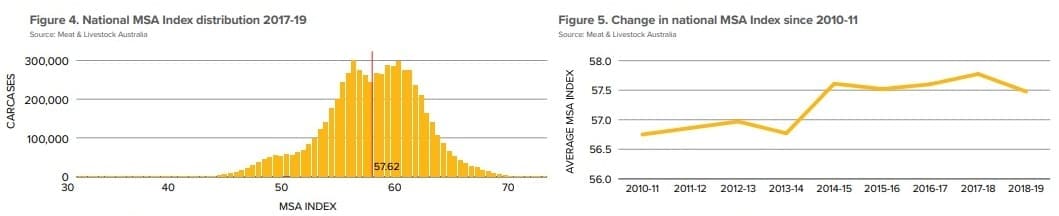
The twin humps in the graph above left are due to different outcomes from grainfed and grassfed MSA cattle. Click on image for a larger view
The MSA Index is a single number between 30 and 80, and is the standard national measure of the predicted eating quality potential of a whole carcase (more background detail below).
The report analysed carcase grading data of 6.2 million MSA-compliant cattle processed in the 2017-18 and 2018-19 financial years, and examined compliance and eating quality performance by production factors including feed type, Hormonal Growth Promotants and gender.
The report highlighted the traits of carcases in the top 1pc of cattle to the bottom 1pc of the MSA Index scale by the various production factors and by state to help producers benchmark themselves and identify opportunities for improvement. It showed that the top 1pcof producers nationally have an average Index of 67.01 and those in the top 25pc are averaging an Index of 60.68. Cattle in the bottom 10pc had an average Index of 51.90 and those in the bottom 1pc averaged an MSA Index of 46.36. The report also outlines the carcase attributes that are influencing these quality bands.
MSA program manager Sarah Strachan said the report also found that 2.1pc of MSA-graded grainfed cattle did not meet MSA minimum requirements last financial year, as opposed to 9.9pc of non-grainfed cattle.
“And while seasonal conditions vary for each state, the average national non-compliance was highest in the cooler months. The main reason for non-compliance across all cattle was high meat pH (above 5.7),” she said.
Ms Strachan said this was the third time the report had been released, building on the inaugural 2015 Australian Beef Eating Quality Audit.
“The report confirms that the opportunity still exists for MSA beef producers to continue to improve the eating quality potential of their herd as well as manage compliance fluctuations throughout the year.
“By improving MSA Index results and compliance, producers can increase carcase value, and create potential for increased profitability and enhanced farm productivity.”
State breakdown
New South Wales
Average compliance – 95pc
Average MSA Index – 57.67
Queensland and Northern Territory
Average non-compliance – 93.3pc
Average MSA Index – 56.37
South Australia
Average compliance – 92.8pc
Average MSA Index – 60.49
Victoria
Average compliance – 95.6pc
Average MSA Index – 60.20
Western Australia
Average compliance – 95.5pc
Average MSA Index – 59.99
Tasmania
Average compliance – 90.5pc
Average MSA Index – 59.82
The ABEQI is an extension of the myMSA Benchmarking tool, which allows producers to benchmark the performance of their herd over time against their region, state or the national herd by selecting for relevant production factors such as HGP status and feed type.
To access the full 2019 Australian Beef Eating Quality Insights report, click here.
What is the MSA Index?
The MSA Index is a number between 30 and 80 expressed to two decimal places i.e. 54.62. It is the weighted average of the predicted MSA eating quality scores of 39 cuts in the carcase.
The Index is a standard measure of the predicted eating quality potential of a whole carcase and is calculated using only attributes influenced by pre-slaughter production. It reflects the impact of management, environmental and genetic differences between cattle at the point of slaughter and can be used across all processors, geographic regions and over time.
Source: MLA