BEEF farm cash income in 2015–16 and 2016–17 were estimated to be the highest in more than 20 years in real terms, a recently released Australian Agricultural and Grazing Industries (AAGIS) survey has shown.
The average rate of return (excluding capital appreciation) of Australian beef cattle farms increased from 0.6pc in 2014–15 to 2.1pc in 2015–16, reflecting the large increases in farm incomes, and was projected to increase further to around 2.9pc last financial year – the highest since 2001.
The comprehensive AAGIS survey managed through ABARES scrutinised beef farms Australia wide that had at least 100 head of beef cattle on hand at 30 June.
Higher beef cattle prices in the past two financial years contributed to strong increases in cash receipts of Australian beef-producing farms, the survey said.
Increased farm input expenditure contributed to an increase in total farm cash costs in 2015–16 and 2016–17, but was partly offset by lower interest rates on farm borrowings.
Higher beef cattle turnoff for the three years ending 2015–16, due to drought, resulted in reduced average herd sizes in most regions of Australia.
Better seasonal conditions in 2016–17 are expected to result in some herd rebuilding, with lower turn-off of cattle for slaughter and higher calf-branding rates.
Farm cash income and profit
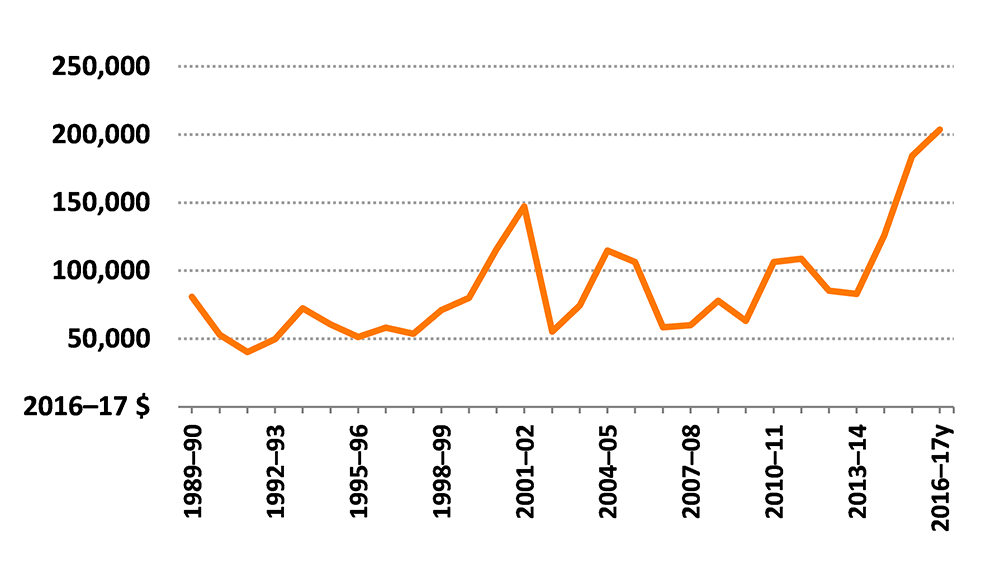
Average beef farm cash income increased by an estimated 48 percent in 2015–16 to around $181,300, as a result of higher total cash receipts, partly offset by a relatively smaller increase in total cash costs.
Average farm cash income (see graph below – click on all graph images to enlarge) is projected to increase further in 2016–17, up by a further 12pc to $204,000. In real terms, estimated average farm incomes for 2015–16 and 2016–17 will be the highest in over 20 years.
Farm business profit is a measure of long-term profitability. It accounts for capital depreciation, payments for family labour and changes in inventories of livestock, fodder and grain held on a farm.
In 2016–17 expected increases in the size of beef cattle herds and high cattle prices will increase farm inventory values, the AAGIS survey said. As a result, the increase in average farm business profit is projected to be larger than the increase in farm cash income. Farm business profit of beef farms is projected to average $125,000 in 2016–17, around 72pc higher than in 2015–16 and the highest in the past 20 years in real terms.
Negative farm business profit means a farm has not covered the costs of unpaid family labour or set aside funds to replace depreciating farm assets. Many farms occasionally record negative farm business profits when their incomes fluctuate. However, ongoing low or negative profits affect long-term viability because farms have reduced capacity to invest in newer and more efficient technologies.
Over the 10 years to 2015–16, the proportion of beef farms recording negative farm business profits averaged 64pc a year. Improved farm financial performance in 2016–17 is projected to result in a decline in the proportion of farms recording negative farm business profit to 40pc.
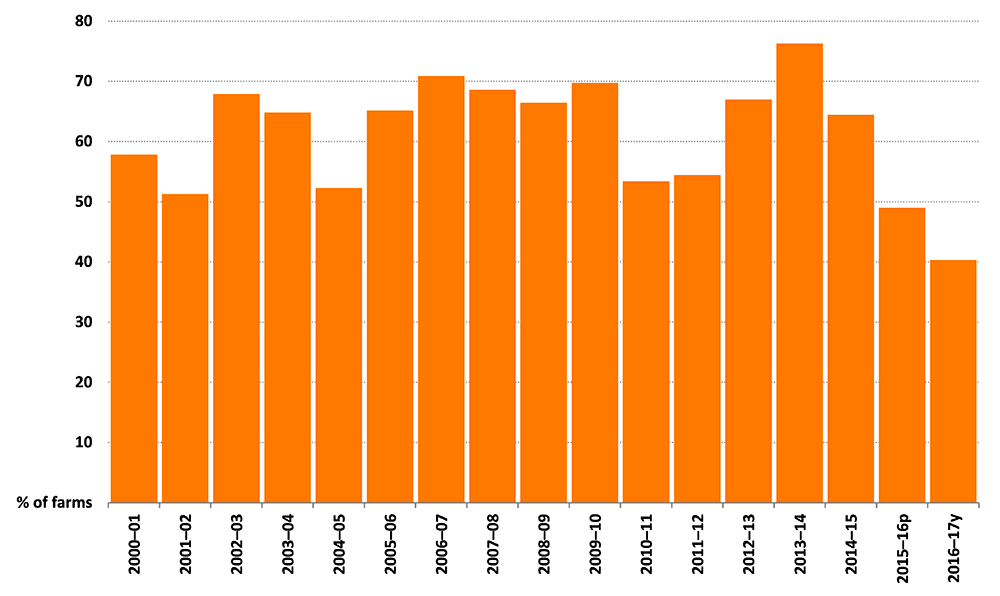
Proportion of beef farms with negative farm business profit, Australia, 2000 to 2017
Total cash receipts
In 2015–16 average total cash receipts for beef-producing farms across Australia increased by 24pc to $485,300, largely as a result of higher beef cattle receipts. Higher receipts were mainly driven by a significant rise in average unit cattle prices and increased turn-off of beef cattle in some areas affected by dry seasonal conditions.
When averaged over the three years to 2016–17, receipts from beef cattle accounted for 62pc of total cash receipts for ‘beef-producing’ farms at the national level, followed by sales of crops and smaller receipts from sheep, lambs and wool in mixed enterprises weighted towards beef.
Average total cash receipts at the national level are projected to increase further in 2016–17 to around $513,000 per farm, largely driven by higher beef cattle receipts.
Rising cattle prices are estimated to more than offset a projected decline in the number of cattle sold in 2016–17. Declining sales are expected to result from herd rebuilding in response to improved seasonal conditions in many beef-producing areas.
Total cash costs
Average total cash costs of Australian beef farms increased by 13pc to around $304,000 in 2015–16 and are projected to rise by a further 2pc in 2016–17. Higher estimated cash costs in 2015–16 and 2016–17 were partly a result of higher prices paid for store and breeding cattle, as well as increased expenditure on hired labour, fertiliser, fodder, crop and pasture chemicals, and repairs and maintenance.
Performance by region and herd size
Most of the increase in average farm cash income at the national level was due to large increases in the incomes of beef farms in the northern region (QLD, NT and top half of WA), particularly among ‘very large’ and ‘large’ farms. The northern and southern Australian regions recorded year-on-year increases in average farm cash incomes in 2015–16, but the northern region recorded a much larger increase in absolute and percentage terms.
In 2016–17 the average farm cash incomes in both regions is projected to be the highest on record at around $169,000 in the southern region (NSW, VIV, SA, TAS and bottom half of WA) and $262,000 in the northern region.
In the southern region, average farm cash income between 2000 and 2016 was around $89,000 (in 2016–17 dollars). Extended drought conditions in 2006–07 resulted in the lowest recorded average farm cash income over the period.
Average farm cash income for the Northern region between 2000 and 2016 was around $121,000 per farm (in 2016–17 dollars). In 2009–10 low beef prices and reduced turn-off because of restocking activities resulted in the lowest average farm cash income over the 16-year period.
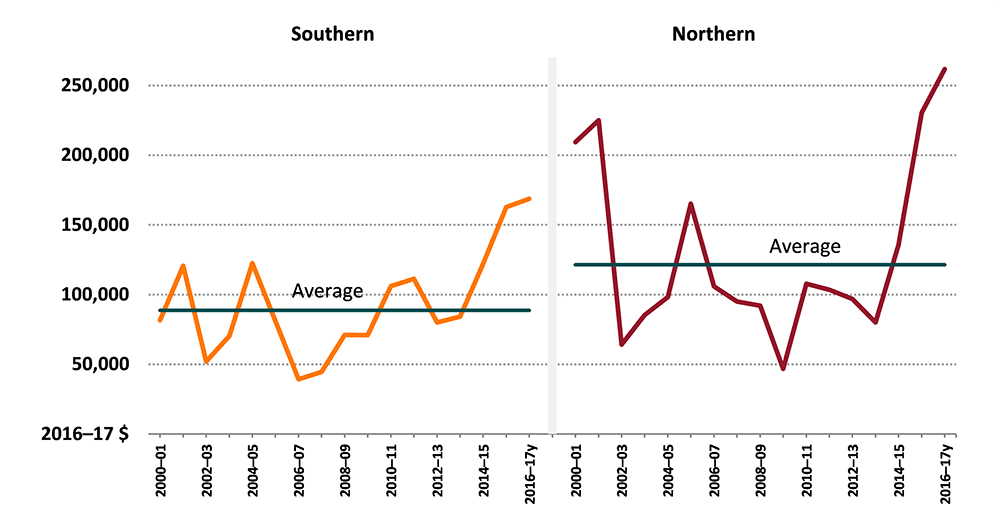
Farm cash income, by region, 2000 to 2017, average per farm
On average, farm cash incomes for very large beef-producing farms (+5400 head of cattle) increased by 128pc in 2015–16, compared with a projected slight fall in 2016–17. Incomes of very large farms are projected to fall because of reduced beef receipts arising from herd rebuilding.
The average farm cash incomes for small (100–400 head), medium (400–1600 head) and large (1600–5400 head) beef farms also increased significantly in 2015–16. Incomes for small and large farms are projected to increase in 2016–17 because higher crop receipts more than offset lower beef receipts. Incomes for medium size farms are projected to fall slightly because of herd rebuilding and consequent lower beef receipts.
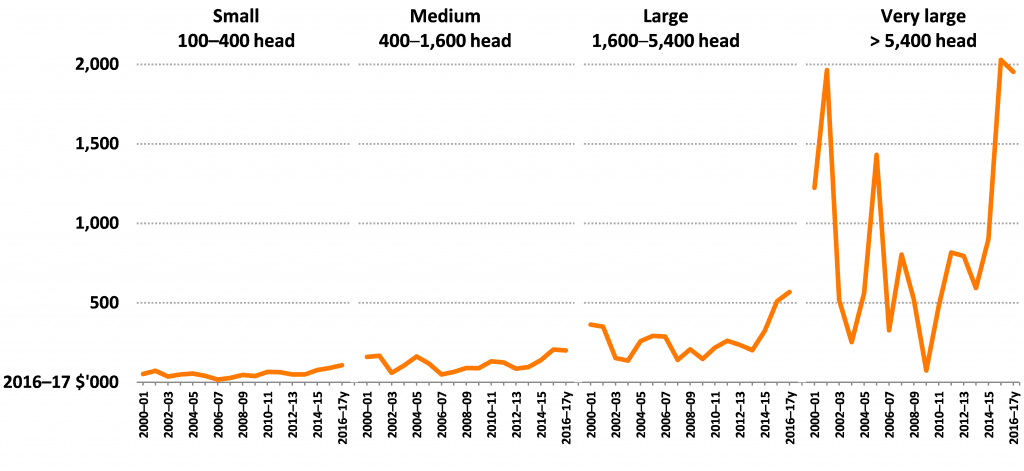
Farm cash income, by herd size, 2000 to 2017, average per farm
Total cash costs
In the Southern region, total cash costs increased by 15pc in 2015–16. The largest rises were in beef cattle purchases, electricity, hired labour, and fertiliser expenditure. In 2016–17 total cash costs in the region are projected to fall by 2pc.
In the Northern region, total cash costs rose by 9pc in 2015–16 and are projected to rise by a further 4pc in 2016–17. Increased expenditure on hired labour, chemicals, repairs and maintenance, contracts and beef cattle purchases was partly offset by declines in other cost items in 2015–16.
Between 2000 and 2016 cattle purchases, interest, and repairs and maintenance accounted for the largest shares of total cash costs in the Southern and Northern regions. Other items accounting for more than 5pc of total cash costs in the Northern region in that period were fodder, hired labour, and fuel, oil and lubricants. In the Southern region, fertiliser, hired labour, and fuel, oil and lubricants each accounted for more than 5pc of total cash costs.
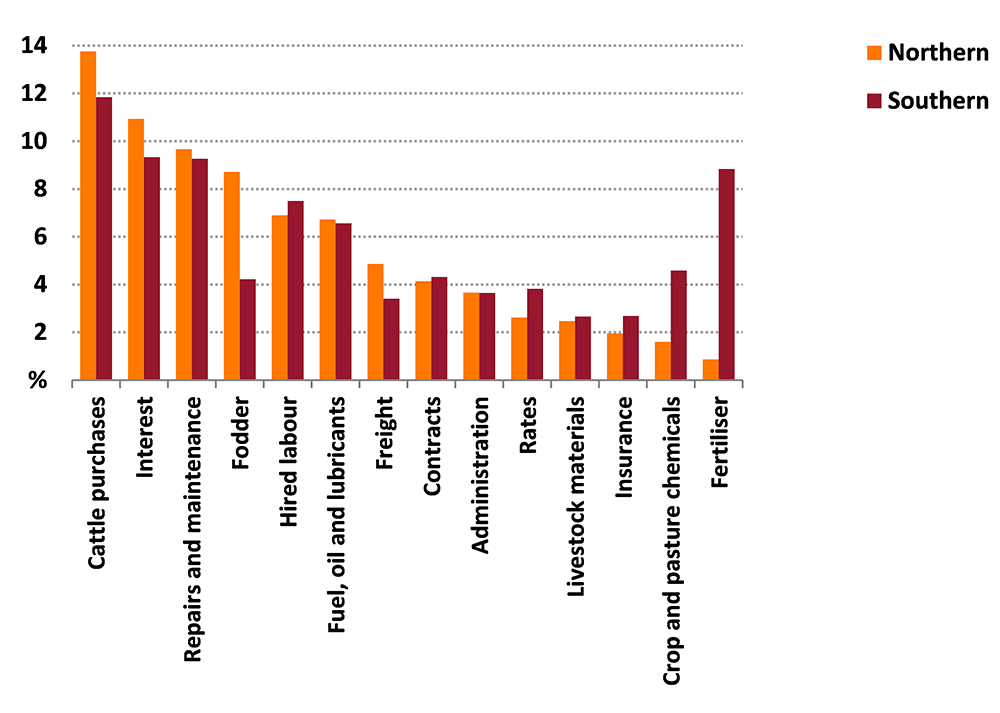
Components of total costs, beef farms, by region, 2000 to 2016, average per farm
Rate of return
The average rate of return (excluding capital appreciation) of Australian beef cattle farms increased from 0.6pc in 2014–15 to 2.1pc in 2015–16. This reflects the large increases in farm incomes. The average rate of return is projected to increase further in 2016–17 to around 2.9pc, the highest since 2001–02.
Between 2000 and 2016, the average rate of return (excluding capital appreciation) was 1.1pc.
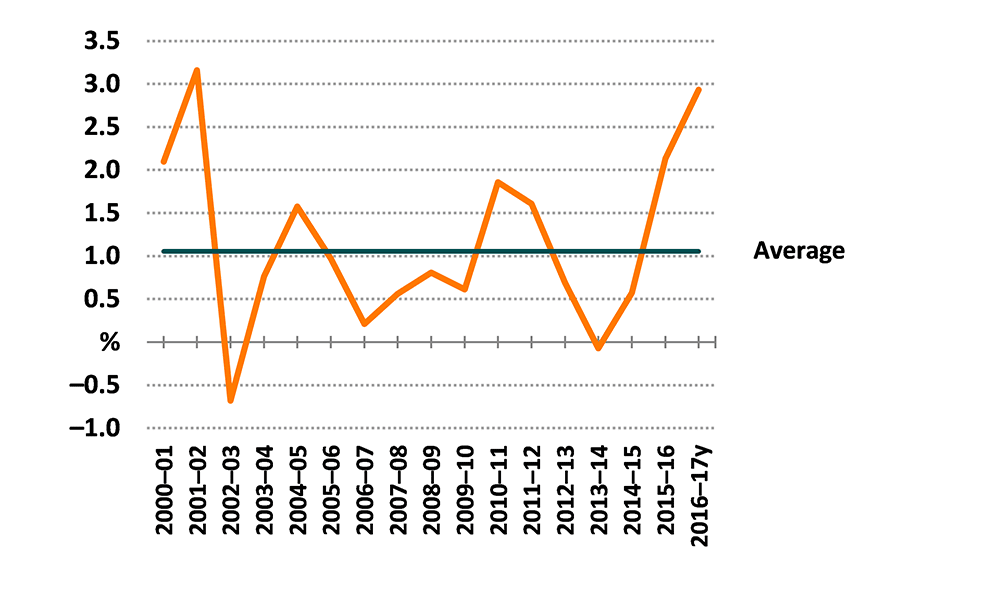
Rate of return, beef farms, Australia, 2000 to 2017, average per farm
The graph above shows that the performance of beef cattle farms varied widely in 2015–16. Almost 20pc of beef farms recorded a rate of return (excluding capital appreciation) of between negative 2.5pc and 0, compared with one-quarter of farms with a rate of return of between 0 and 2.5pc.
Improved financial performance in 2015–16 resulted in a larger proportion of beef farms recording a rate of return (excluding capital appreciation) greater than 2.5pc (up from 19pc to 32pc). This reduced the proportion of farms with rates of return below negative–2.5pc (down from 19pc to 9pc).
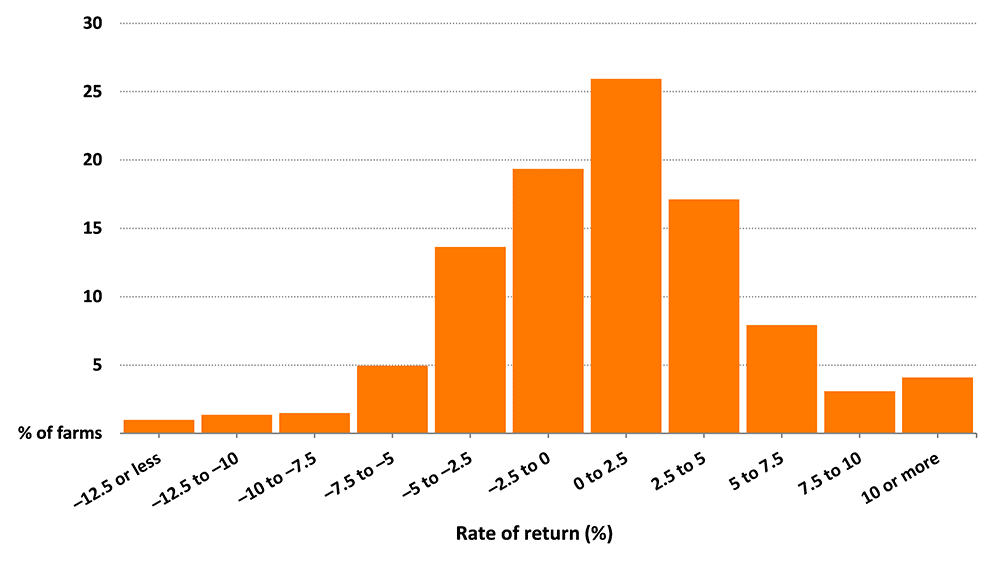
Distribution of beef farms, by rate of return, 2015–16
Variation in rates of return
The long-term performance of farm businesses is determined by the level and variability of profits, the AAGIS survey said. The variation in the average farm rate of return to capital (excluding capital appreciation) between 2000 and 2016 reflects changes over time in average seasonal conditions, commodity prices and the cost of farm inputs recorded in each region.
Individual farms are likely to have experienced different variations in returns over the period, depending on seasonal conditions and commodity prices that were realised and other farm-specific factors such as enterprise mix and the skill of the manager.
The Northern region performed slightly better in the best 25pc of years and had a higher median rate of return at around 1.25pc, against about 0.8pc for the southern region.
Source: ABARES