
THE amount of time rural property listings have spent on the market has trended higher in most parts of Australia over the past six months, while the number of active listings and new listings has been generally stable, a recent property market analysis carried out by Elders has found.
Generated using data provided by PropTrack, the report is compiled from Valuer Generals’ department records for properties 40ha or more in rural Local Government Areas. Worth noting, these are all property sales fitting the profile – not just Elders’.
The results are seen as a broad-brush summary of the rural property market trends, rather than a deep dive into individual commodity areas or specific asset types.
Within a wider suite of data generated, the report includes leading indicators including new listings, active listings and days on market.
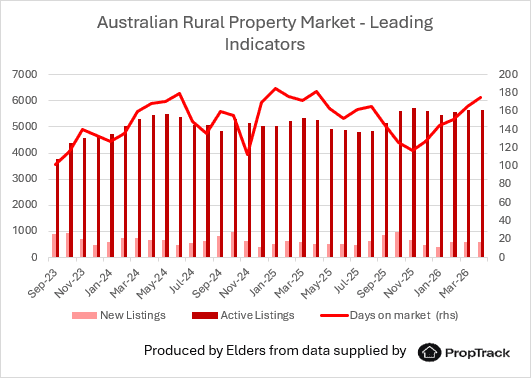
As this national graph shows, the average time spent on market has lifted from around 115 days back in November last year to about 170 days in April.
New listing numbers have stabilised at around 500/month (all property sizes from 40ha), while total rural listings remain around 5600 – being little changed since August-September last year
Here’s a brief snapshot for the three key metrics by state/territory:
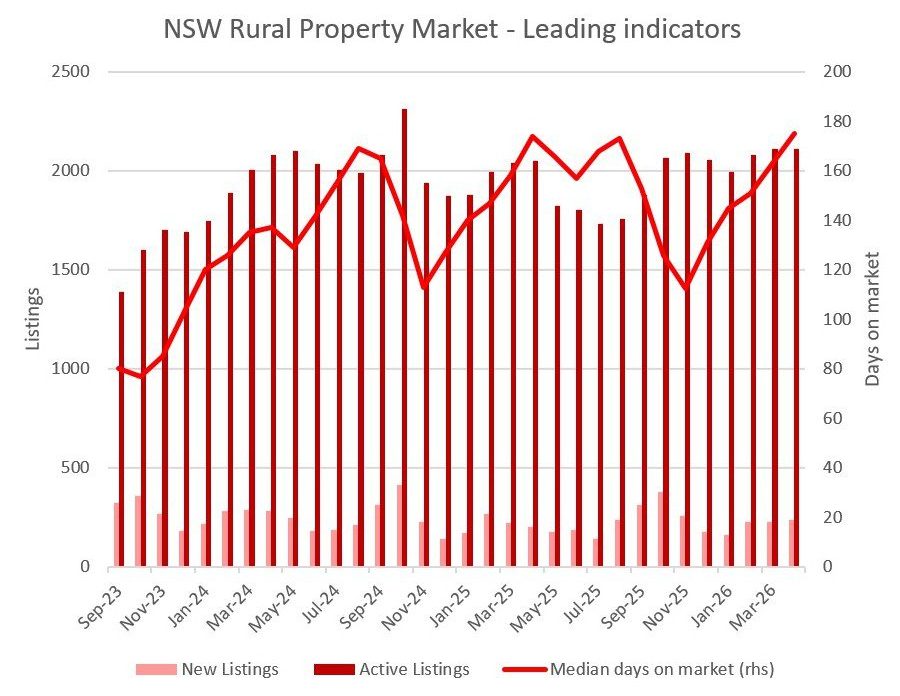
New South Wales
The New South Wales rural property market has shown a surge in time spent on market since November last year, with weather a factor in some regions.
Current active listing numbers remain around 2100, with new listings rising since December to around 200.
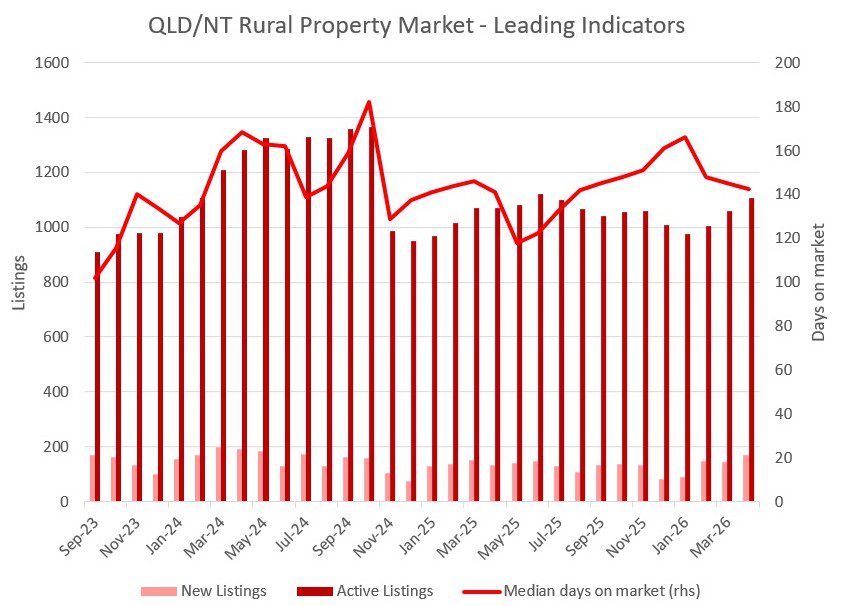
Queensland/NT
Going against southern states, there has been a decline in time spent on market in Queensland and the NT, perhaps reflecting better overall seasonal conditions. Back in January, average time spent on market was about 165, declining to 140 days in April. New listings have risen a little since January, now around 180. There’s been gradual growth in overall property listing numbers since January, reaching 1100 by April.
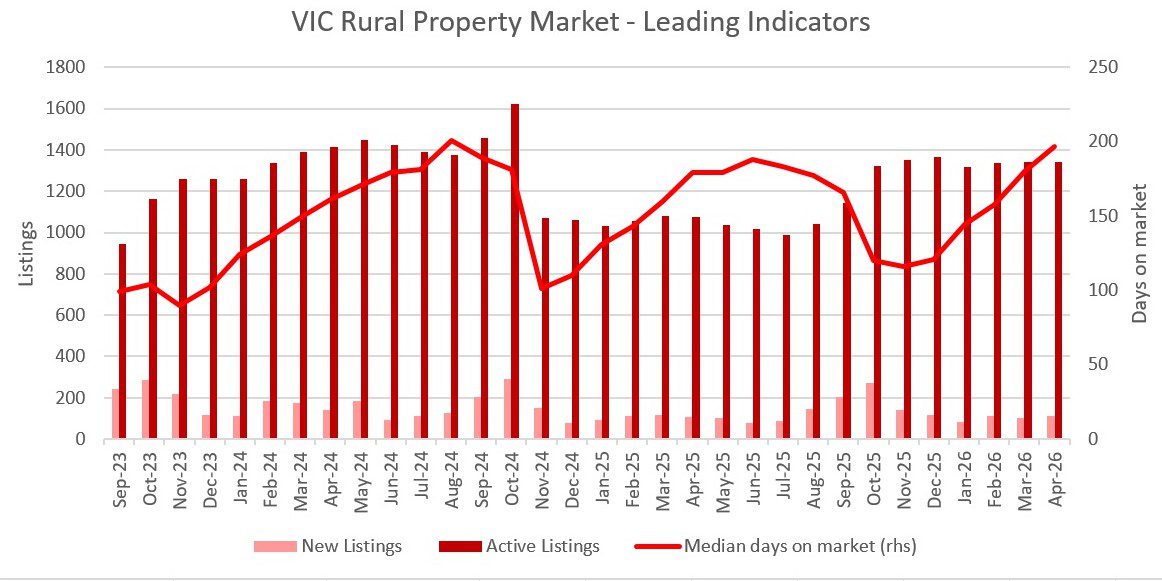
Victoria
Victoria’s rural property market has seen a lengthening in duration spent on market since November, now out to 205 days, the longest in Australia.
New monthly listings are steady at around 100, while total listings are little changed since September last year, at around 1350.
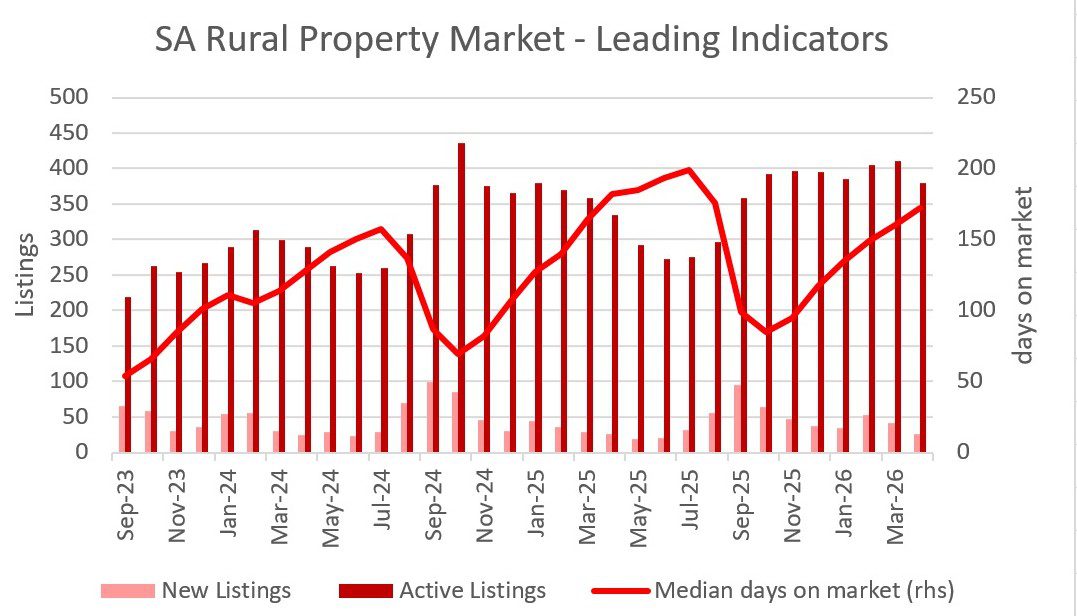
South Australia
South Australia’s trend lines are similar to Victoria’s, with a big surge in time spent on market to 175 days, up from only 83 days last September.
There’s been a gradual decline in new listings since September, currently sitting at around 25.
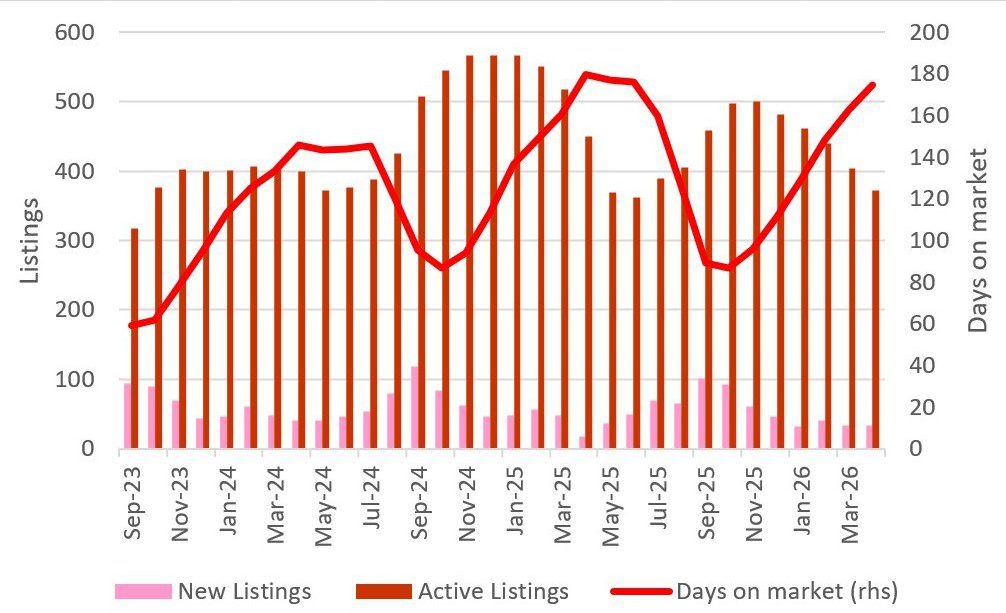
Western Australia
The broader East Coast trends are also evident in WA, where time spent on market has climbed to 175 days in April.
Overall listing numbers in WA have trended down since November last year, reaching 360 in April – a seasonal trend reflected also in the previous two years.

HAVE YOUR SAY