
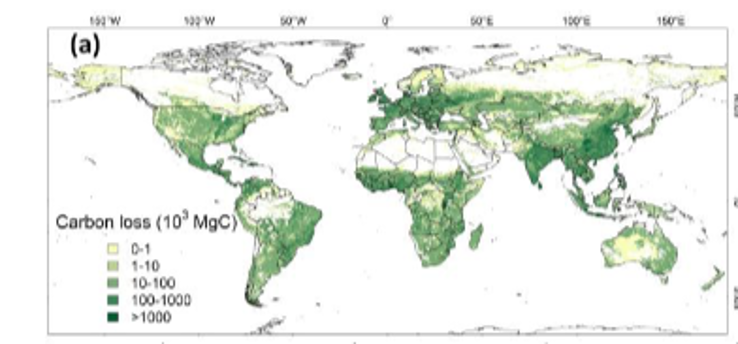
The University of Oxford this month announced that international trade in cattle products – beef and dairy – accounted for 29 pecrcent of global carbon loss. However, a drill-down shows that Australia is a very small part of that tally.
The new research issued by the University’s Martin School shows that the environmental impacts of agricultural trade are concentrated in China, India, Brazil and the EU.
Brazil’s exports of beef and pork from to China, along with pork from the USA to China were the largest three international flows of embodied carbon loss, according to the study.
However, the largest three biodiversity flows were exports of beef and pigmeat from Brazil to China, along with beef from Australia to China.
Cattle products accounted for 41pc of global biodiversity loss, according to the report printed in Nature Food journal.
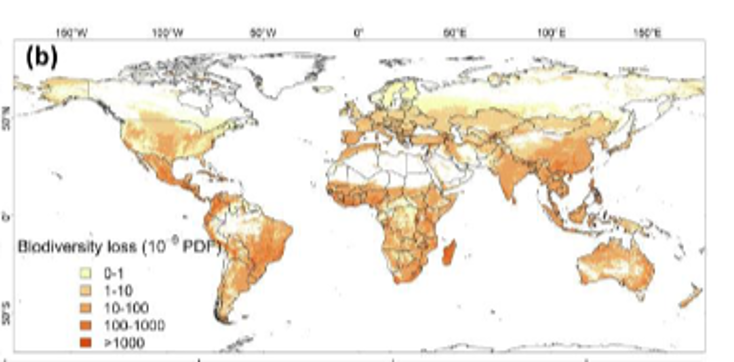
 The study found that while the Northern Hemisphere experiences greater carbon loss, the Southern Hemisphere records higher biodiversity loss.
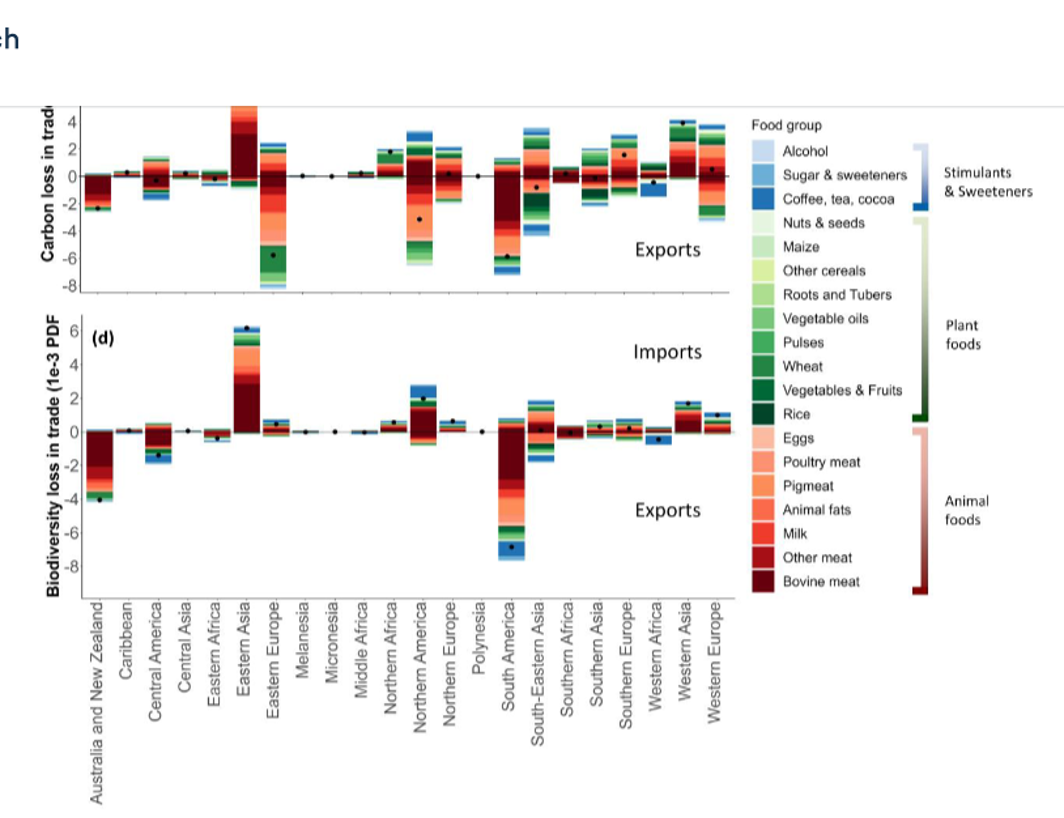
Australia/NZ recorded a carbon loss of of -2PgC (petagrams of carbon) for agricultural exports, well below the -8 for Eastern Europe and -7 for South American exports, the US -6 and SE Asia -4.
However, in terms of biodiversity, measured as the potentially disappeared fraction (PDF) of species, Australian/NZ agricultural exports accounted for a -4 loss, second after South America’s -7.
Brazil is the largest net exporter of both carbon and biodiversity loss, while China is the largest net importer.
The research was led by Leiden University in collaboration with the University of Oxford and China Agricultural University.
The results were drawn from the international food trading of 22 geographic regions.
Rather than relying on simple land-use maps, lead researcher Baoxiao Liu and the team used high-resolution mapping to trace the long-term carbon and biodiversity losses from agriculture. Working across the world’s land surface at about 5km resolution, they followed back through complete supply chains.
It meant they were able to connect a particular food product from where it was produced with the consumers whose demand ultimately drives production.
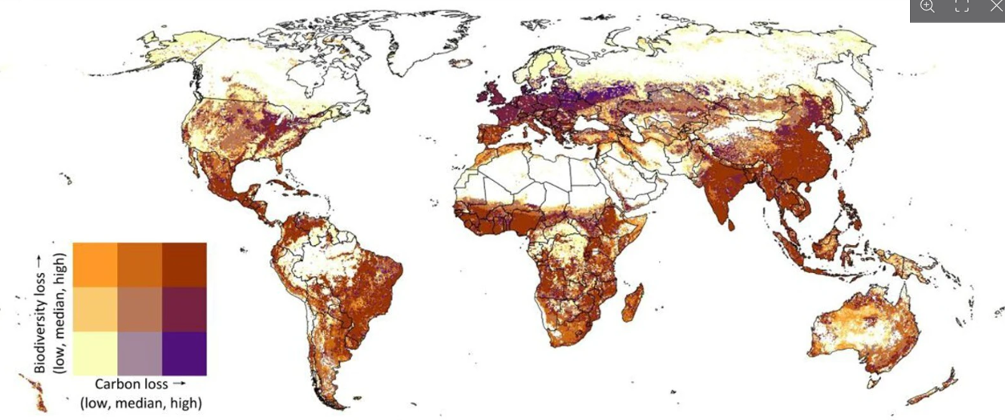
Prof Paul Behrens at the University of Oxford explained the methodology: “Make a map of where farming costs us the most stored carbon. Draw another of where it costs us the most wildlife and lay them on top of each other.
“The carbon equals around 300 bn tonnes – broadly 140 years of everything farming currently emits from field to farm gate. (And) on biodiversity, 14pc of species are put at risk of extinction.”
Two-thirds of both losses happen on a third of global farmland. For biodiversity, half of the loss is concentrated in 10pc of the area and 80pc in 34pc of the area.
Globally, the analysis identifies food consumption as the dominant force behind the losses, and is responsible for 83pc of the carbon and biodiversity losses measured in the study.
Animal-sourced foods alone account for 59pc of carbon losses and 71pc of biodiversity losses. Beef and milk stand out as the largest product-level contributors.
Read the report at https://www.researchsquare.com/article/rs-5527595/v1
* petagrams of carbon = 1 petagram = 1 bn tonnes carbon mass.
Yippee doo da. People need food. Are you really gonna save the lesser crested worst and let people starve? Are you gonna celebrate the building of soil carbon while people starve? Nonsense!