The number of animals presented for MSA grading grew to a record of 4.13 million cattle in 2024-25, representing 47 percent of the national adult cattle slaughter, and 1.25 million lambs, or 4.8pc of the national slaughter, according to the program’s newly-released annual performance report.
MSA beef
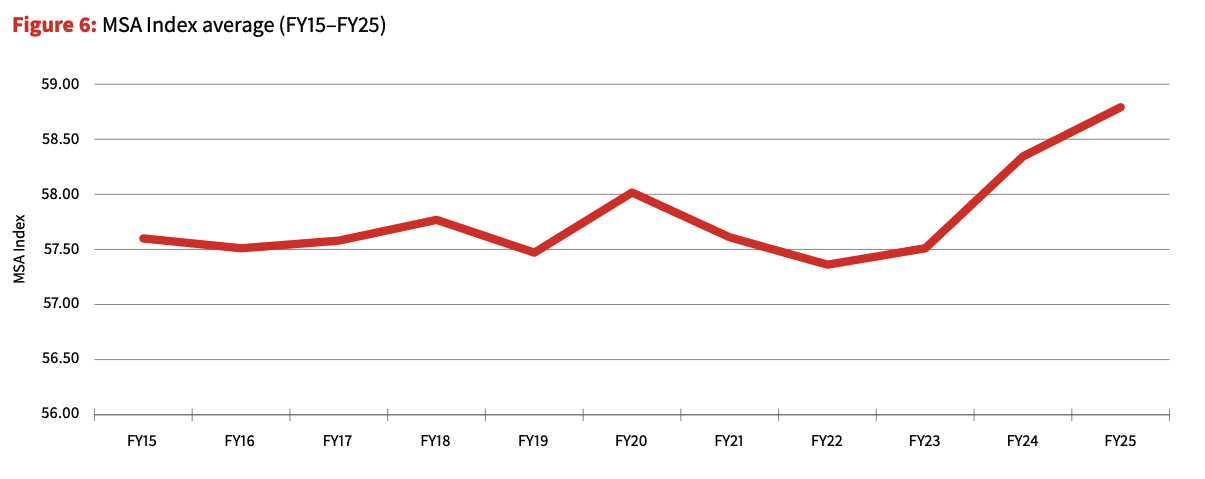
The past financial year also recorded the best eating quality result since the MSA Index was introduced, reaching a record high with an MSA Index average of 58.81 (see above chart).
Grainfed cattle achieved an MSA Index average of 59.35 (up 0.97 year-on-year).
The report attributed the higher score to a decrease in ossification, an increase in MSA marbling, a decrease in hump height and reduced HGP-usage from 47 percent down to 42 percent.
The average MSA Index for non-grainfed cattle was 58.22 (down 0.12pc year-on-year).
Queensland had the largest improvement in MSA Index year-on-year, gaining 0.57 points to 56.71.
WA achieved the highest MSA index by State or Territory with an average of 61.02 (up 0.47 points year-on-year).
“This continued improvement in MSA Index and ultimately, the eating quality of beef, means there are 10 percent more 5-star tenderloins, 14 percent more 4-star cube rolls, and 10 percent more 4-star striploins compared with 10 years ago,” MSA Program Manager David Packer says in the 2024-25 MSA annual outcomes report.
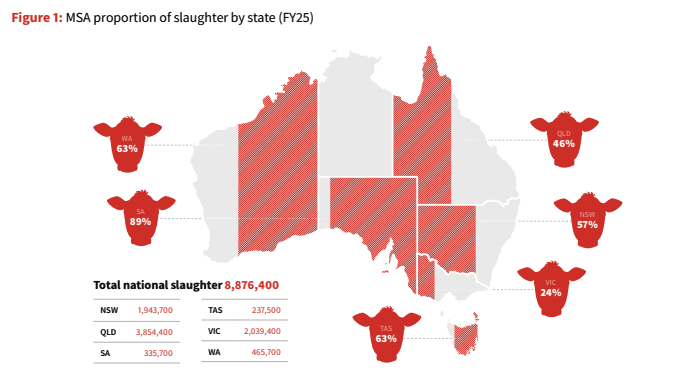
4.23 million cattle from 13,824 beef producers were presented for MSA grading at 41 Australian processing sites in 2024-25.
The report estimated that the MSA program delivered $409 million in additional returns at farm-gate level for MSA compliant beef carcases in the 2024-25 year.
The number of licensed brands underpinned by MSA grew in 2024/25 to a total of 197 beef brands and 22 sheep brands.
The proportion of Hormone Growth Promotant (HGP)‑treated cattle in FY25 was 25 percent (down 4pc year-on-year). For MSA graded grainfed cattle, 42 percent were HGP-treated in FY25 (down 5pc year-on-year)
By state, Queensland presented the largest number of cattle for MSA grading, with 1.78 million head from 2,865 producers, or 43 percent of the total number of cattle presented for MSA‑grading in FY25 nationally.
NSW presented the second largest number for MSA grading, at 1.11 million head, from a total of 3,971 producers.
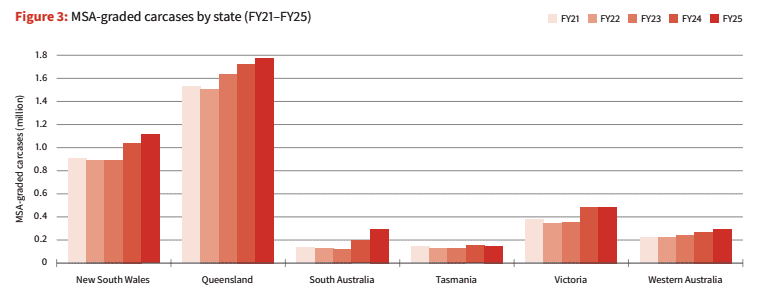
Additionally, the largest increase in numbers graded from South Australia and Western Australia was seen in FY25, at a 52 percent and 9 percent increase respectively.
In FY25, national compliance to MSA minimum requirements was 94.8pc, improving 0.8pc from FY24. Compliance to MSA minimum requirements improved throughout the year, from 94pc in July 2024 to 96pc in June 2025.
MSA Sheepmeat
A total of 863 new sheep producers and 1180 new mixed livestock producers became MSA registered in 2024-25, taking the overall number of sheep producers rising to 27,521.
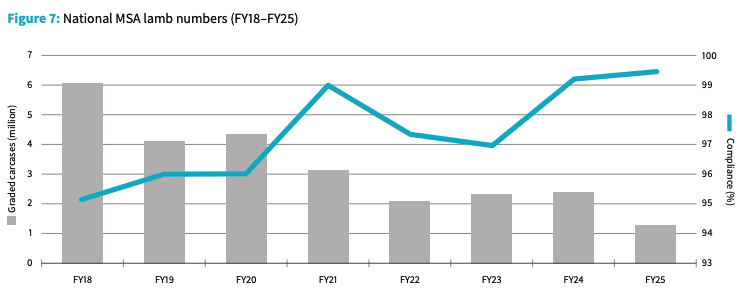
WA processed the highest number of lambs through the MSA pathway at 470,000.
NSW had the highest increase in lambs going through the MSA pathway from the previous year, an increase of 18 percent.
A total of 99.5 percent of all lambs presented for MSA met the minimum requirements – an increase of 0.2 percentage points on the previous year.
The financial year also saw the completion of the MSA saleyard research for cattle and sheep, enabling an extension of the cattle pathway to 48 hours and saleyard consignment now being included as part of the of the new cuts-based model for sheepmeat.
The report said two sheepmeat supply chains have partnered with MLA to begin the process of enabling the MSA sheepmeat cuts-based grading model.
Retail feedback
MLA research conducted with 150 butchers and 50 wholesalers showed that 59 percent of those surveyed rated MSA brands as “very to extremely” important in their product offering.
Butchers continue to charge more for MSA beef, with a price gap of 8.1 percent between MSA and non-MSA beef (up 6.2 percent year-on-year).
Wholesalers also continue to charge more for MSA cuts, through the gap has reduced since the previous year (9pc in FY25 compared to 16.7pc in FY24).
To read full report click here