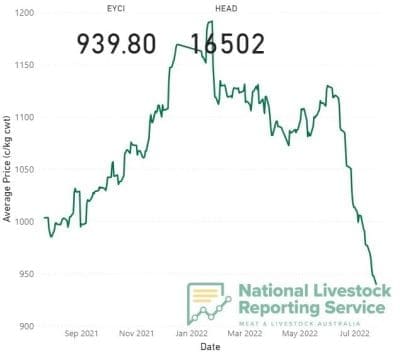
ANYBODY looking at today’s Eastern Young Cattle Indicator graph, plotting prices for the past 12 months, might assume the world is about to end.
Certainly the current sharp correction which set in in early June looks extreme, to say the least. The market for young cattle* (*see definition of cattle eligible for the EYCI below) has now fallen almost 190c/kg carcase weight in the past seven weeks, or 16.4 percent (remember that percentage figure, because it comes into play further below in this item).
On a typical light backgrounder steer weighing say, 330kg liveweight, that’s a fall of a not insignificant $360.
 A not dissimilar trend has been seen in slaughter cattle over the past seven weeks (see today’s separate weekly kill report). Four-tooth grass ox that were worth as much as 790c/kg early this year are now making 680c/kg on one company’s grid in southern Queensland. That’s a fall of 14pc.
Another key factor in the decline of slaughter market pricing in recent months is processors’ reduced capacity to kill stock at present, due to staff sickness caused by COVID and common flu. That is significantly reducing production capacity at plants from Victoria all the way into Central Queensland this month.
Add that to the growing mood to shift cattle as a hedge against market melt-down, should FMD find its way into Australia, and the normal seasonal impact of heavy frosts on pasture condition, and it presents an elevated risk of more severe cattle price damage, unless there is a somewhat orderly approach taken by producers.
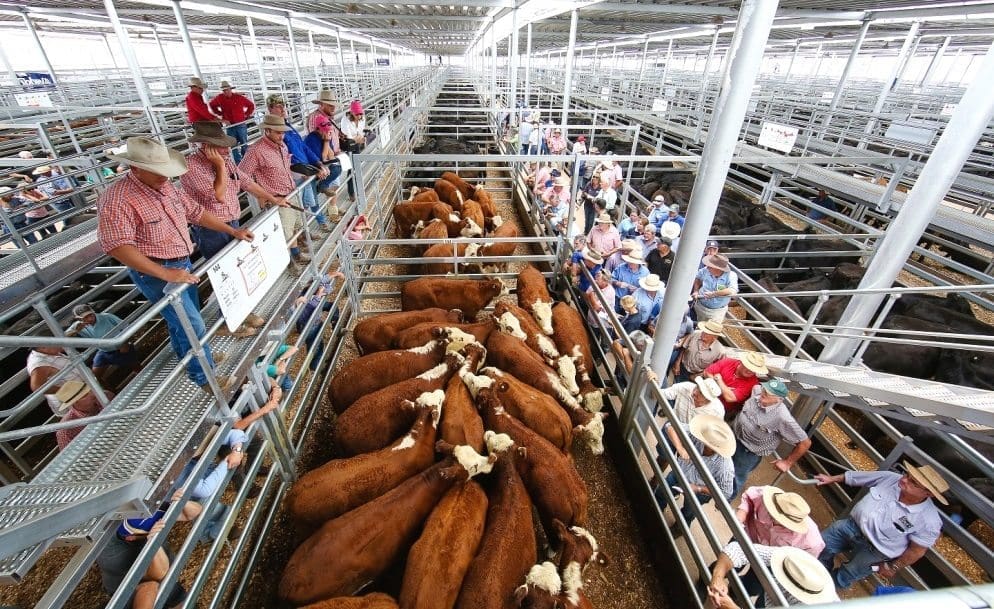
As Beef Central has written a number of times over the past fortnight (click here to view a recent report on feeder steer price movements), fear and uncertainty over the impact an FMD incursion in Australia would have on the cattle market is now bearing a strong influence on the cattle market, for both store and meatworks-ready cattle. Producers are clearly hedging their bets, considering it better to take some cattle off the table and turn them into cash, rather than risking exposing their entire herd to market collapse.
But it’s important to put recent price movements in greater context.
The graph published above shows the trend over the past 12 months only. Its shows the current price dipping below where it was this time last year, after a dramatic rise in-between, from December to early June. In short, it looks like a disaster.
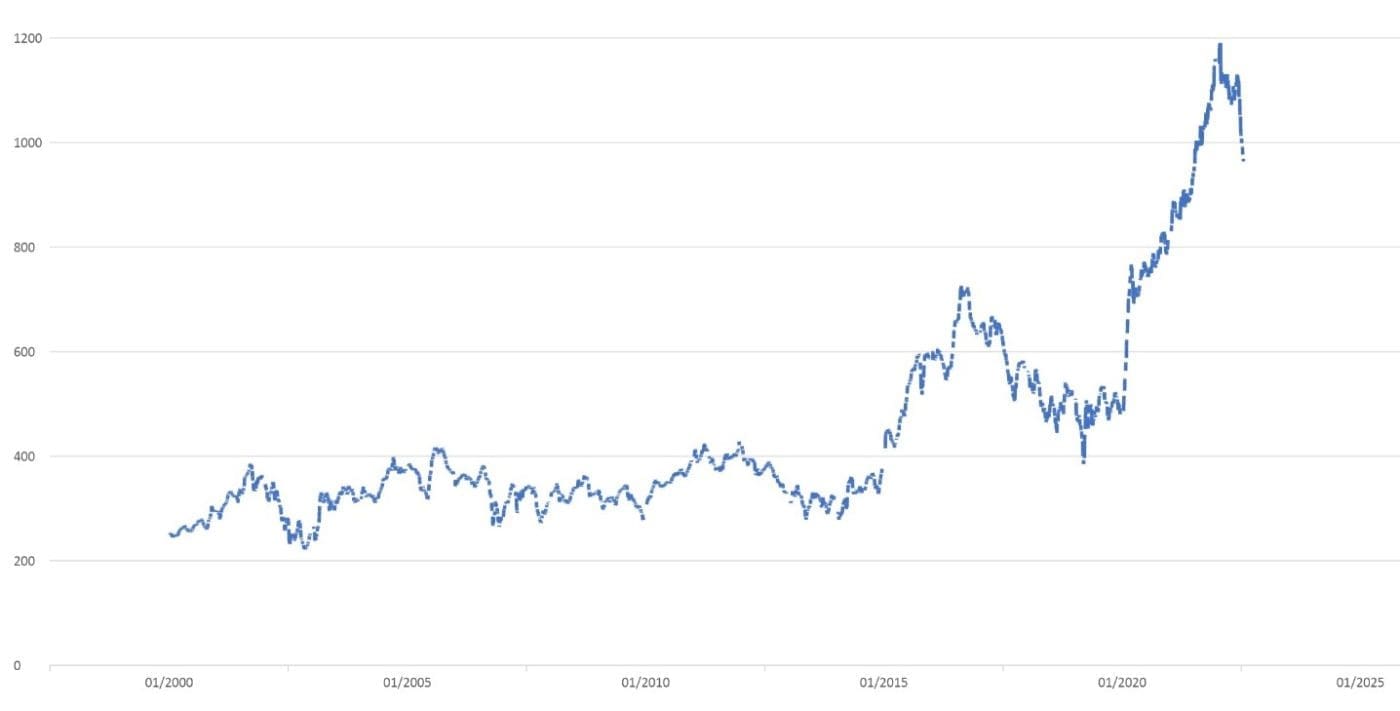
Now have a look at the second graph published below, plotting the EYCI’s movement since 2000 (22 years).
Click on image to enlarge
It shows that even accounting for the recent dramatic decline, the EYCI today remains far, far above anything ever seen before June last year.
This time two years ago, for example, the EYCI sat at 756c (about 190c/kg below today’s figure) and a year before that, 531c/kg (408c/kg behind today’s rate).
In fact the EYCI average for the past five years has been 724.6c/kg – a whopping 215c/kg or 29pc below today’s figure. Hardly throw-yourself-off-a-cliff stuff.
The ten-year average for the EYCI, since July, 2012 (capturing all of the ‘modern’ price trend that kicked in during 2015) has been just 590c/kg.
Historic view of price collapses
Also clearly visible on the second graph are a series of extreme young cattle price collapses seen across the Australian beef industry since 2000.
The most obvious of these were in 2002-03, 2006 and 2019.
The 2002-03 impact came from the worldwide alarm caused by BSE detections in the UK, followed by Japan, Canada and the US. The 2006 episode was caused by extreme drought across large parts of eastern Australia, together with re-entry of US export beef in world markets after BSE suspensions; and drought again reared its ugly head in 2019, driving the clear market collapse see in the graph that year.
So how does the current price decline episode measure up against these earlier episodes, in percentage terms?
To refresh readers’ memories, the current price fall amounts to a 16.4pc drop in EYCI value.
Compare this with:
- The episode in 2006, when prices fell 30pc in a matter of months (380c/kg to 267c/kg)
- The three months to mid-March 2019, when drought forced EYCI prices to fall 27pc (526c to 385c), and
- 2002, when prices fell 26.5pc from May to June, after BSE struck overseas.
In this context, this year’s 16.4pc decline looks reasonably mild, despite the outright numbers involved (190c/kg decline in value).
All of this makes today’s average young cattle price still look reasonably healthy, despite the obvious rise in operating costs that have occurred more recently.
MLA’s Stephen Bignell said the size of the current price decline was magnified by the extreme high ‘starting point’ before the current price slide started.
“The quantum of the current fall seems large, given the starting base price was above 1100c/kg,” he said.
Another factor was that throughput among EYCI-eligible cattle had risen 60pc over the past month, due to a combination of factors – tax considerations after June 30, and frost impact on pastures among them.
“There is a lot of supply at the moment, putting further downwards pressure on prices,” he said.
* Understanding the EYCI
The Eastern Young Cattle Indicator, or EYCI, is a seven-day rolling average of young cattle (vealer and yearling weight steer and heifer categories) from 23 saleyards across Queensland, NSW and Victoria. It is expressed in c/kg, carcase weight equivalent.
The EYCI is designed to be applicable to a wide range of beef industry participants across the supply chain. It describes general movements in cattle market prices in much the same way that the All Ordinaries share index describes general price movements in the stock market. It is generally a good indicator of the physical market, with movements closely reflecting movements in other MLA cattle prices, including the National Vealer and Feeder Steer Indicators. Movements in the EYCI also closely reflects movements in young cattle prices in states outside the EYCI’s (Queensland, NSW and Victoria). This is expected, as many major Australian and global factors that influence beef demand and supply have an impact across all states. Price movements in WA, SA and Tasmania follow the general trends of the EYCI due to the influences described above. However, these states show evidence of other price trends related to distance from major markets, focus on other trades such as live export and local factors such as meatworks closures or openings and regional weather influences.