 Woolworths and Coles have made small gains in retail beef market value share in recent months, but Woolworths still lags a little behind major competitors in terms of maintaining its share of trade on a yearly average basis.
Meat and Livestock Australia this month moves to a new monthly retail fresh meat market share analysis, provided by Neilsen Australia Homescan. It replaces the previous Roy Morgan single-source data that has been used for the past ten years (see explanatory notes below).
While there are some variances between the two reporting systems, the relative positions of the three major retail competitors – Coles, independent butchers and Woolworths – remain much the same.
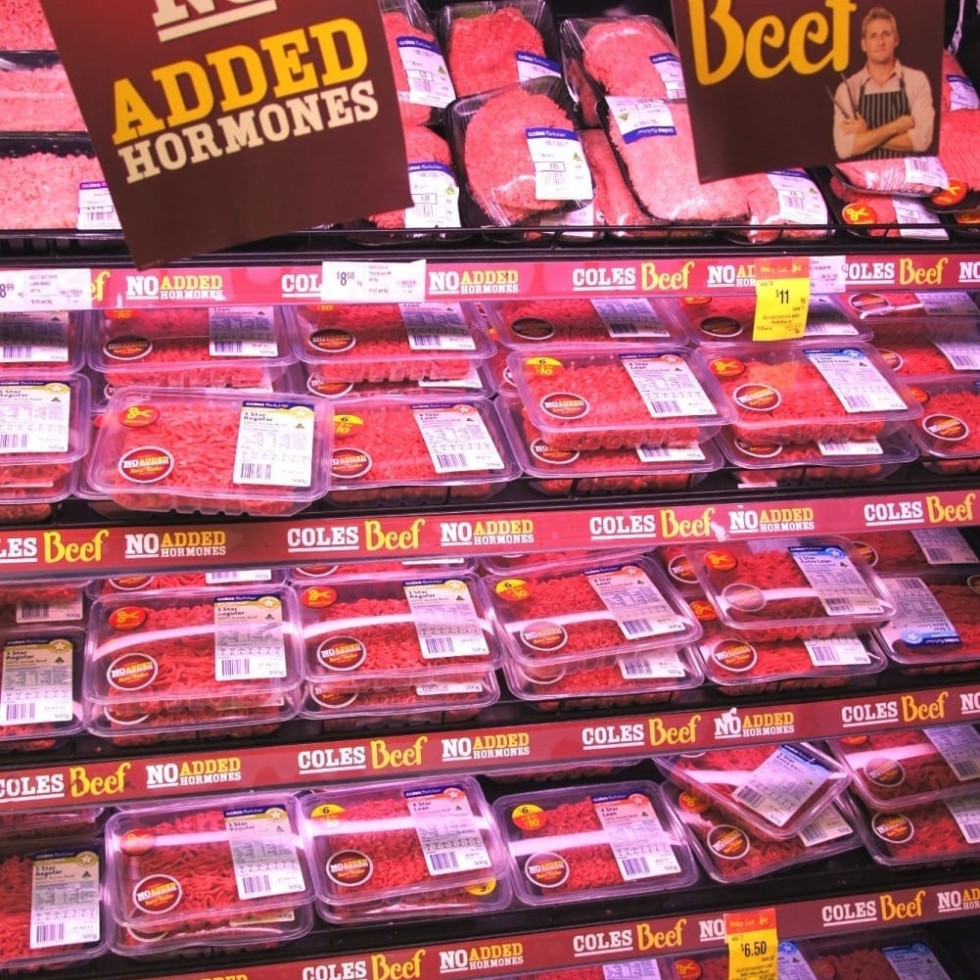
The Neilsen Homescan data released by MLA on Friday shows Woolworths’ national beef share grew marginally during the rolling quarter to February 18, lifting to 31.1pc from 31pc in January, and 30.7pc in the December reporting period.
Coles share over the same cycle also grew a little, from 25.5pc in January to 26pc by February 18. Independent butchers finished the last reporting period virtually on even terms with Coles, with a 25.9pc share of retail beef trade, measured by volume.
Longer-term trends tell a slightly different story, however.
Woolworths’ monthly average turnover for the last year has averaged 32.3pc, suggesting a -2.1pc volume share in the most recent February 18 survey compared with longer-term performance. Coles was +1.3pc on its yearly average, while independent butchers were -0.6pc.
Others to perform better than their 12-month average share last month included Aldi Supermarkets, up 1.4pc, and ‘other’ supermarkets, +0.7pc. The independently-owned IGA chain fell slightly behind, being -0.6pc.
In terms of meat protein category share, beef’s rolling quarterly share for February continued a lower trend, at 36.5pc of total retail expenditure on red and white meat protein. That’s down from figures above 39pc towards the latter stages last year. Chicken and lamb followed a similar pattern. Chicken was back to 24.8pc of share in the last survey, from earlier highs above 26pc.
The reason? The Neilsen Homescan monthly data clearly picks-up the inroads that traditional festive season protein options like turkey, seafood and pork have over the Christmas period. All recorded solid rises, off their low base levels, over the surveys affected by the holidays.
In terms of price, beef recorded a soft average price decline over the past three months, to $10.00/kg average in February, down from $10.30 in November. Chicken has remained largely unchanged for the past five months at around $7.40/kg, while lamb has improved from $11.60/kg average price to $12.10 over the past four months. Fresh pork has softened to around $10.00kg, from $10.30 in November.
The February survey’s broader conclusions about meat protein purchasing patterns saw an overall rise in value growth, despite average occasions-per-buyer dropping. This positive growth was driven by an increase in value-per-occasion.
This again reflects festive season expenditure on more expensive items like seafood, remembering that the figures are based on rolling three-month averages.
Understanding MLA’s new retail reporting system
MLA has provided fresh meat purchasing information based on Roy Morgan single-source data for the past decade. The information was based on a door-to-door survey that estimated purchasing, based on respondents’ descriptions of how many serves they had bought in the previous seven days.
Recently MLA decided to switch to a different survey, Nielsen Homescan. This data is extracted from 10,000 households nationwide, each using special bar-code scanning equipment to record all grocery purchases that enter their home.
The Homescan data represents actual purchases rather than stated serves. In MLA’s opinion, this delivers a better estimate of the actual trends in fresh meat expenditure.
As always, switching data providers means some differences in results. MLA has provided some briefing notes on what users might expect to see in contrasts between Roy Morgan to Nielsen reports:
- Fresh Meat: The overall market share for each meat type is similar in each survey (+/-5pc)
- Beef records a higher share in Nielsen than Roy Morgan (+5.7pc on average), while pork and chicken share decreases. This could be because of beef’s higher average price relative to the other two meat types.
- Chicken (-1.7pc) and pork (-2.6pc) have lower value shares in Nielsen
- The shares for veal (-0.5pc) and lamb (-0.9pc) are slightly lower in Nielsen
- National channel share, beef and veal:
- Nielsen data is more stable than Roy Morgan
- Specialty (butchers) is the only channel with a lower beef and veal share in Nielsen (-5.6pc on average). Specialty has a lower share for all meats except chicken. The nature of the specialty shop could result in a lower capture rate in Nielsen and a higher rate in Roy Morgan, MLA says. The exception (chicken) is caused by the fact that fresh chicken specialty shops are now included in the sample.
- Coles (+3.2pc) and Woolworths (+1.1pc) have the biggest positive difference in channel share for beef and veal
- IGA (+0.6pc) and Aldi (+0.6pc) have very similar shares across the two data sources.
MLA concludes that overall, there is not a considerable difference in the data trends observed between Nielsen and Roy Morgan. Nielsen offers a more stable trend and the use of value instead of volume data, giving a more ‘realistic picture’ of the market, it says.
- To read MLA’s full explanatory notes on the changes to the monthly retail survey, click here


HAVE YOUR SAY