KNOWING the long-term carrying capacity (LTCC) is essential information for managers of extensive grazing businesses.
As highlighted in a previous Beef Central article, it is a controversial issue, however there is an established, evidence-based process for estimating long term carrying capacity.
Let’s start by defining what carrying capacity is. The long term carrying capacity is the number of animals that a property (or paddock) can support over a planning horizon (10+ years) with no decline in land condition. The figure is typically expressed in Animal Equivalents (AE).
Current carrying capacity is based on current land condition and watered area, whereas potential LTCC is based on best land condition state and assumes the area is fully watered (source: Australian Beef Report: 2020 Vision).
In order to calculate the carrying capacity for an area it’s important to know how much pasture is available for consumption. The climate, soils and vegetation of the location under scrutiny determine the productivity that can be achieved and establish the biological limits for production.
To determine how much pasture is available for grazing, the following information is needed:
- Land area
- Land type and species composition
- Current land condition
- Tree density and size, usually measured on-ground as tree basal area (TBA)
- Median annual pasture growth in ‘A’ land condition
- Safe annual pasture utilisation rate
- Watered area
Land area is straightforward, the land type and species composition will determine the pasture growth that can be expected. There is some good information available on land types on the Futurebeef website and on the Forage section of the Long Paddock website. In many rangeland areas, high tree density can suppress pasture productivity, so a measure of this is important for establishing how much pasture is available.
Land condition influences how much dry matter is produced from a given rainfall event on a particular piece of land. Land in very poor condition will produce much less available pasture from the same rainfall event as land in good condition.
In northern Australia, an ABCD ‘report card’ style rating system is used to describe land condition. Research has shown that land in B condition produces 75 percent of the pasture growth of A condition, C produces 45pc and D produces 20pc or less.
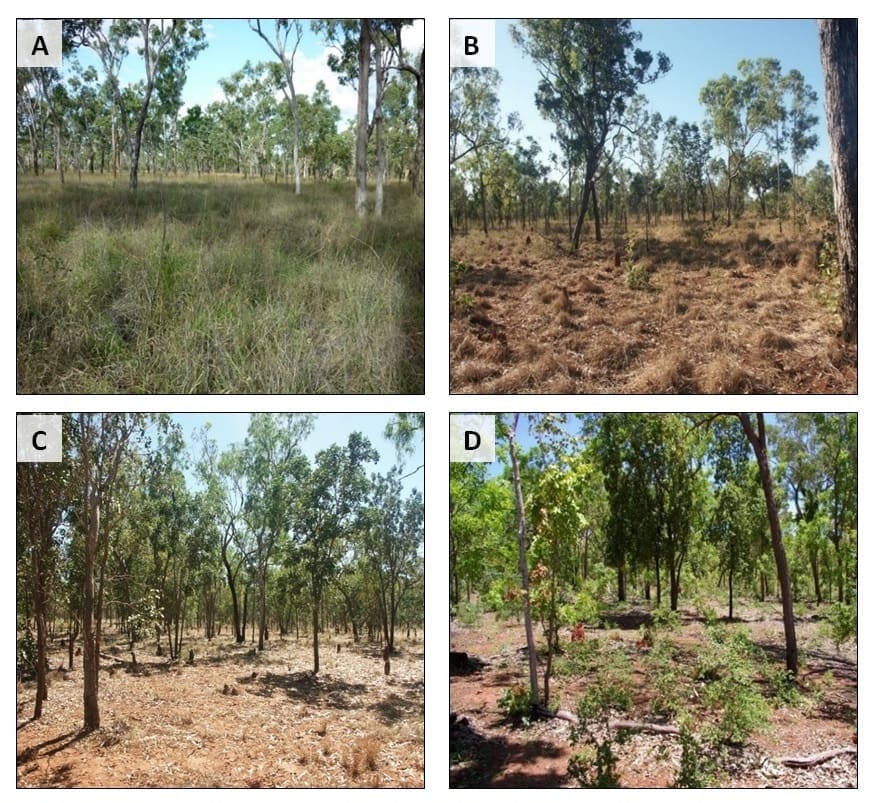
ABCD land condition ratings for a savanna woodland. Note the decline in 3P grass density, increased bare ground and woody vegetation thickening as land condition declines in this example (Source – Australian Beef Report: 2020 Vision).
The median annual pasture growth is the dry matter that will be produced in a “middle of the road” year – pasture growth will be higher than this figure half the time, and lower than this the other half. The median pasture growth figure for land in A condition is adjusted to reflect the current land condition using the percentages mentioned earlier.
Distance to water takes into account whether country is easily accessible to water. The optimum distance to water is regionally-dependent. Research has found that in extensive rangeland conditions, 90pc of grazing occurs within 5km of watering points. A 3km grazing radius is the optimum across most of the rangelands and higher (up to 8km) in more arid areas and lower (around 2km) in more productive areas.
This is a complex area in itself and specialist advice should be sought.
The safe pasture utilisation rate is the amount of this year’s pasture growth that can be safely grazed by livestock without impairing land condition. It varies with land type and species composition but is typically in the range of 5-30pc. Managing utilisation is a critical issue in managing land condition, as chronic over-utilisation of pastures is the primary cause of land condition decline.
All of the above gets us to a point of having an estimate of the dry matter available for livestock consumption.
In order to calculate how many animals this can support, we need to know how much they eat. Recent work in this area has provided improved estimates for use in grazing and business management. The outcome of that work was an intake constant of 8kg DM/AE/day.
The Animal Equivalent (AE) approach provides a common measure for measuring and comparing animals of different classes and sizes for grazing management. The AE ratings of different animals is a function of their energy demand relative to the standard animal (a 450kg Bos taurus steer with zero liveweight gain). See www.bushagri.com.au/ae for more info.
Below is an example table of all of this put together for a paddock.
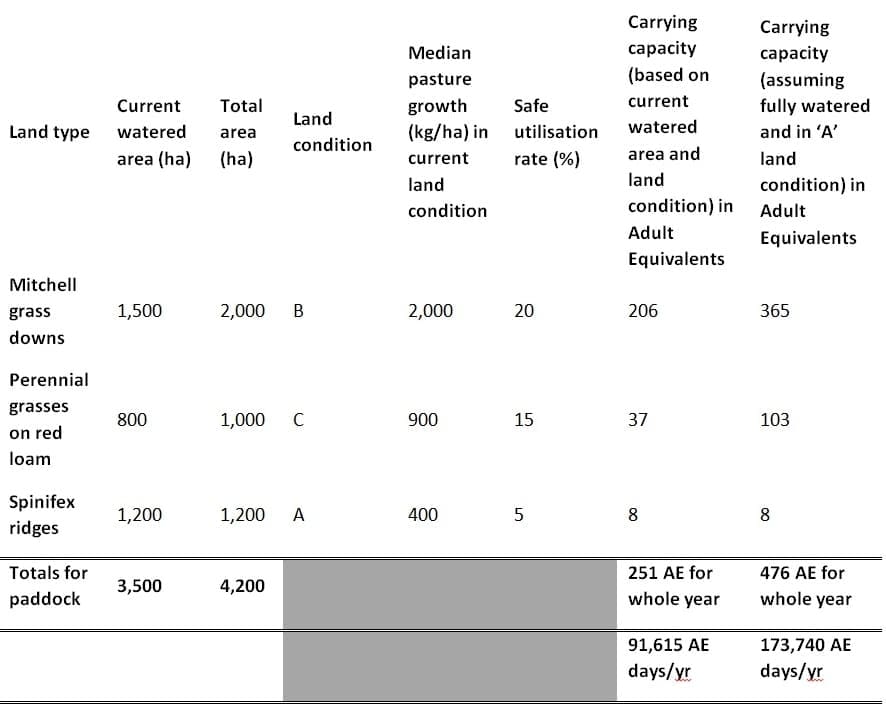
The resulting figure is a benchmark, and its accuracy is a function of the accuracy of the data that contribute to it (much the same as estimates of GDP or unemployment). Over time, the veracity of this benchmark figure can be tested by comparison with long-term livestock numbers, livestock performance and land condition trends.
Having an accurate historical record of numbers carried around your long-term carrying capacity and changes (improvements) in land condition over time makes a compelling argument if someone says you are running too many.
There is extensive evidence out there that overstocking doesn’t pay and that appropriate stocking rates are best for your bottom line and your country in the long term. A good starting point is the results of the Wambiana grazing trial or the dedicated chapter on this subject in the latest Australian Beef Report.
An exciting new resource that will help inform carrying capacity estimates is the prototype Long-Term Carrying Capacity Report available on the Forage section of the Long Paddock website.
From here, a long-term carrying capacity estimate can be provided for any grazing property in Queensland (using lot/s on plan). The assumptions used for the estimate are also provided and follow the same logic as mentioned above; and the report output can be modified by the user through the use of an accessory spreadsheet to refine the estimate.
A key feature through adjusting the calculation for land condition is that the user can see how increases in carrying capacity can be made with improved land condition. The new report is currently at a prototype stage, however it will be refined over time. Importantly, it provides a good, independent, starting point for assessing long-term carrying capacity.
Understanding long term carrying capacity, and matching stocking rate to carrying capacity in both the short and long-term, are fundamental aspects of grazing business management. There are big long-term implications from getting them wrong.
It is also an important part of due diligence, but knowing the value of a property goes much further than simply applying a beast area value. This approach allows the price of different sales to be compared on a like-for-like basis, but has limited application in determining the value for individual buyers.
This article has been prepared for Beef Central by Bush AgriBusiness with input from Ian McLean, Phil Holmes, Dionne Walsh, Col Paton and Grant Stone. The content draws from a chapter in The Australian Beef Report: 2020 Vision on ‘The effective utilisation and preservation of the natural resource base’ in northern Australia. The chapter was prepared by Dionne Walsh and Col Paton, two of the leading grazing land management advisors in northern Australia. A corresponding southern Australia chapter was written by Bob Freebairn.


This is not hard to address
Just go back to what our grandfathers done
Properties had a carrying capacity and when they were balloted out depending where you were situated it was part of the covernance
Southwest and western Queensland were about 6000 sheep and 100 head of cattle. These properties always survived the worst drought.
I see these same properties advertised for sale with a two and three thousand head carrying capacity in season. What a short season.
I remember a neighbor of my grand father saying to him (He owned a property on the lower Bulloo River below Thargomindah) If we had water out there on our boundary Roy we could Run More sheep.
My grandfather responded,: No Roger we will run less sheep. Once that grass out there is gone all our sheep are dead We will come out of a drought with nothing left.
I an not one for government controls but the damage being done to our pastoral lands is unbelievable and it has to be stopped
Great work, Ian McLean and Bush Agribusiness!!
This type of analysis across a look through the cycle (LTTC) approach of median numbers at peak, or a monthly weighted average, for a rolling 10-year period, has been necessary and essential on each property as a management and valuation tool for many decades …
As an aside, you can get right into this analysis in depth and find a degree of comfort; and for those that like detail and granular feedback, this approach is definitely for them !
I tend to step back from the granularity for a wider purvey … and keep it simple (to remove the ‘noise’ from the analysis).
I look at the Livestock Schedule from signed Income Tax Returns for >=5-years (preferably >10-years), and take the Median … of course, the boundary-fence makes a constant area … so do check that area (size) hasn’t changed via acquisition or sale … and adjust accordingly … it’s very important to compare like with like …
Thus, the Sustainable Stocking Rate (SSR) emerges; as a number an Grazier may plan upon.
It is important to remember that SSR is not a number to maximise; but rather to minimise … and with a margin of safety … such that ‘less is more’ … and the benefits will appear in the Median Sustainable Carrying Capacity (SCC): and maximising of Numbers sold across the 10-year time-frame.
Managing available pasture, to maximise Kgs./Beast-Sold/Unit of Area/mm of Rainfall, and out through the farm-gate each year, and knowing when to pressure-on, pressure-off in Grazing, is a most important tool for long-term success in the Livestock Grazing Game … IMO
A very good summary. Also important not to forget that animals other than livestock (kangaroos, wallabies, rabbits, goats, camels etc) take their share. There are useful conversions for these animals to AEs. It’s total grazing pressure that must be factored.
Yep 👍 well said ! A Kangaroo might eat and drink and much as a Sheep … competition from a non-revenue source … a ‘pest’
Is it as simple as this?
Our grandfathers who survived the depression did so by adopting very conservative stocking rates
The wet 50’s ( and also the 70’s ) allowed us to stock much heavier
And allowed the closer settlement schemes which were very temperory
Much of these closer areas have been amalgamated back closer to the original areas
Were Governments that wise as I remember comments ( vested? ) voicing concerns re the sustainability of these schemes
Add climate change ( anthropogenic and non anthropogenic plus colder as well as warmer ) what will the future trend be ?
The last decade has delivered close to record floods and droughts
Add also pasture run down ,
Maybe the survivors will simply be the nimble ones and Darwinism will determine the winners
However the recent drought has delivered significant tree mortality which with the aid of a few lightening strikes may well open up the landscape again and allow higher production for a time
Tessa Vance ( Tassie Uni and ex CSIRO) stated ( based on measuring salt in ice cores in Antartica which reflects conditions in the Pacific Ocean ) that the last 100 years ( up to 2009) were unusually dry , similar to 1000-1200 AD. She also identified a 40 year mega drought late in this period
We simply live in a country with the most variable climate in the world and Qld has the most variable in Australia and how many of the climate forecasts predict that accurately?