 By any measure, Meat Standards Australia has had a strong operational year, recording a bunch of impressive key performance indicators in its 2010-11 financial year report being released to industry this week.
The program graded more than 1.42 million cattle for 2010-11 with strong additional growth in MSA producer registrations, processor uptake and clear price drivers through the trade.
The graded numbers last financial year were up 11 percent on the previous 2009-10 year. The increase is a result of a combination of newly-licensed plants adding to the grading numbers, as well as existing processors increasing their throughput and percentage of production being graded.
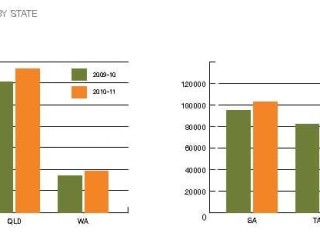
As the accompanying graph shows, there were considerable increases in grading numbers in Victoria, which for much of the past decade has lagged behind other states in MSA uptake, with a 267pc rise on 09-10.
Tasmania also recorded a strong increase of 23.5pc. South Australia, Queensland and Western Australia, where adoption rates were already relatively high recorded increases of 8.7pc, 10.7pc and 12pc respectively.
A total of 2075 additional producers registered for MSA supply during the year, bringing the total number of suppliers nationwide to 19,000.
Carcase quality, MSA compliance
 Of all cattle presented for MSA grading during 2010-11, a record 94.3pc (1.34 million head) met compliance to MSA Standards, a significant lift on 2009-10 which averaged 91.7pc compliance. Strong seasonal conditions across the continent are an obvious contributing factor, particularly among grassfed MSA programs.
Of the 5.7pc (81,000 head) non-compliant carcases:
- 4.2pc (56,333 head) had high pH levels – (5.71 and above)
- 4.4pc (61,160 head) failed the meat colour specification, 1b-3
- 0.9pc (12,801 head) had less than the minimum 3mm rib fat requirement.
Licensee audits
During 2010-11 a total of 1563 audits were conducted on licensed end-users – retail, wholesale, supermarkets, foodservice outlets and processors. That represented 97pc of all licensed MSA end-users and 100pc of MSA processors, an increase of 19pc from 2009-10.
The majority of issues highlighted in the audit process were classified as ‘minor non-compliance’ to the MSA standards. This was commonly due to onsite storage, lack of relevant documentation and access to the MSA standards manual. There were 81 major Corrective Action Requests (CARs) out of 1563 audits (5.2pc).
All non-compliance issues reported during 2010-11 have now been corrected in accordance to the MSA Standards, the annual report said.
Price premiums for MSA beef
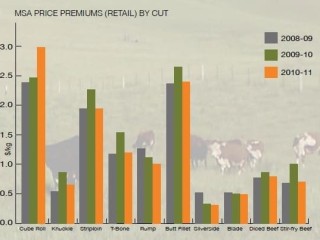 A distinct price premium, together with an increasing proportion of butchers and wholesalers selling MSA graded beef and an 11pc jump in numbers graded indicated strong demand for MSA beef during 2010-11.
Value is important to wholesalers and they need quality and consistency to justify paying more for MSA product. Some wholesalers have found that price has become more of a reason to switch suppliers, as quality is more consistent.
An MLA-commissioned Clever Stuff independent survey conducted in April showed that rump (67pc), cube roll/scotch fillet (67pc), striploin/porterhouse (58pc) and tenderloin/fillet (41pc) are the most consistently purchased MSA beef cuts.
At retail level, the average price differential for MSA beef across all primal cuts in 2010-11 was $1.25/kg. Cube roll averaged the highest retail margin overall at $2.95/kg, followed by butt fillet at $2.39/kg and striploin, $1.92/kg.
At wholesale level, the median wholesale price differential for MSA beef across all cuts was $1.40kg. Wholesalers found that tenderloin and cube roll were the most expensive MSA beef cuts to purchase and Millward Brown noted that all MSA beef prices had increased significantly since a similar2009 survey.
The survey also showed that 100pc of wholesalers are aware of the MSA program and 97pc had at least a fairly good understanding of it.
Cattle prices:
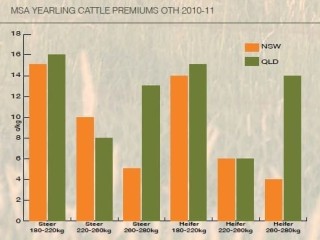 Over the hooks cattle prices for MSA yearling cattle were higher on average than non-MSA yearling cattle in Queensland and NSW, with several supply chains now offering premiums.
The average premium for MSA yearling cattle across all weight ranges was $0.15c/kg, based on MLA’s NLRS data.
Producer, end-user training:
Success of the “Beefing-Up Performance” MSA producer workshops continued in 2010-11 with 40 workshops delivered across the nation, attracting 861 attendees.
The new ‘Next Step’ Producer workshops also proved popular with three focussed sessions and 78 participants. The ‘Next Step’ workshops have been designed to give producers an overview of how to utilise their carcase grading data and MSA online tools to optimise the conformance and performance of their cattle to MSA standards.
During 2010-11 MSA trained 1499 producers through both beef and sheep sessions.
MSA also delivered 2518 end-user (food service/retail) modules to 1239 participants in 2010-11.
The end-user modules focus on how to implement the MSA program as well as value adding MSA primals to optimise eating quality and profitability.
- Publishers note: There was a typographical error in figures in the first version of the graph, "MSA grading numbers by state" appearing at the top of this page when uploaded this morning. The error has since been corrected. Apologies for any confusion.


HAVE YOUR SAY