INFORMED decisions require careful analysis, and careful analysis requires accurate data.
It is no different when it comes to buying property, as good data takes away the sentiment and brings the process back to a clear business decision.
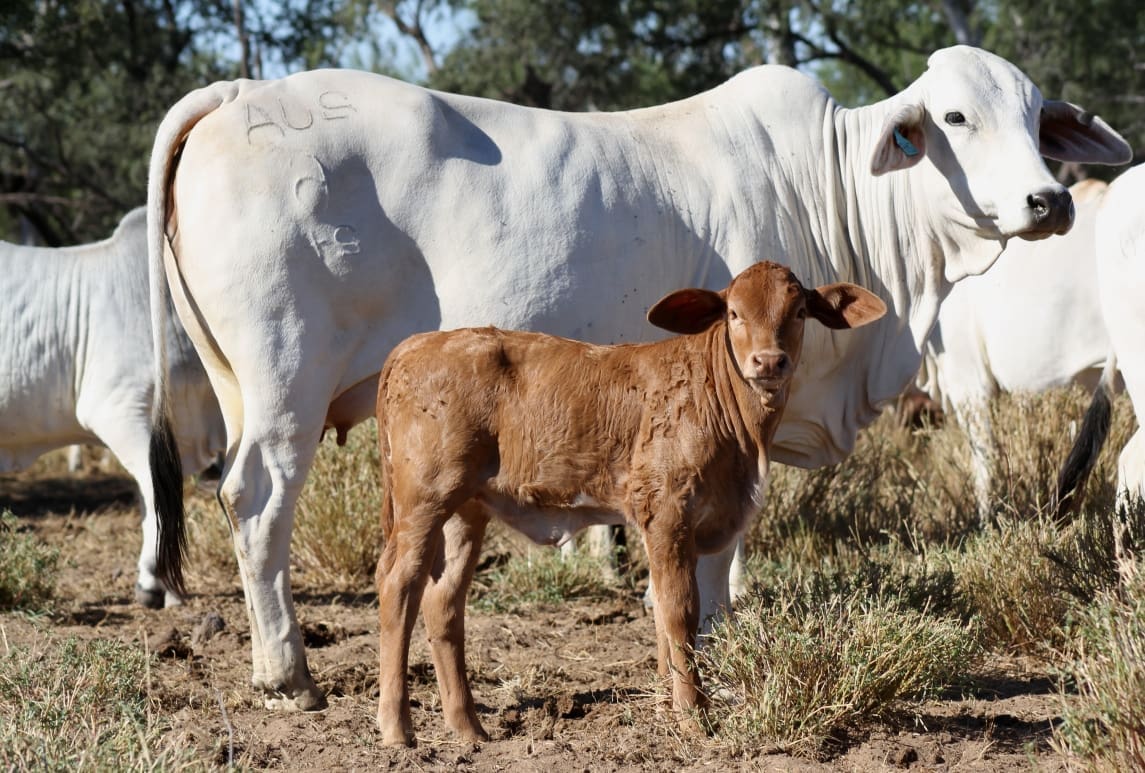 Over the last five years, experienced and widely respected rural land valuer Peter Honnef has analysed a number of beef cattle breeding property transactions in a specific sub-market area in the Goldfield and Basalt country, in the Charters Towers Region of North Queensland.
Mr Honnef, CBRE’s director of agribusiness valuations, said he chose the area because it was a good market indicator of beef property sentiment. In addition, it provided a good cross-section of operations from breeding through to backgrounding and growing.
By comparison, other areas hadn’t moved at all, he said.
“Queensland’s downs country, where it is all black soil and Mitchell/Flinders grass, is absolutely bare and there has been very little property movement,” Mr Honnef said.
Comparing ‘apples with apples’
In an attempt to value each of the properties equally, he stripped-back the sale price to land content only.
Cattle, plant and equipment value was removed, as was the value of buildings. What was left was a value that is termed TFW – Treated (cleared), Fenced and Watered.
The core principal of valuation, Mr Honnef said, was to compare ‘like with like’, ‘apples with apples’, and ‘oranges with oranges.’
“That gives a pure land price level of value. Then we look at the land on a dollar per beast area basis,” he said.
“The carrying capacity is estimated by the number of adult equivalents a property can carry. When we talk about AE, it is 450kg/beast. Once all those standards are adopted, the figures show a trend-line. Using a moving average, the trend line shows the market (in the nominated area, at least) has bottomed and has been rising since the beginning of this year.”
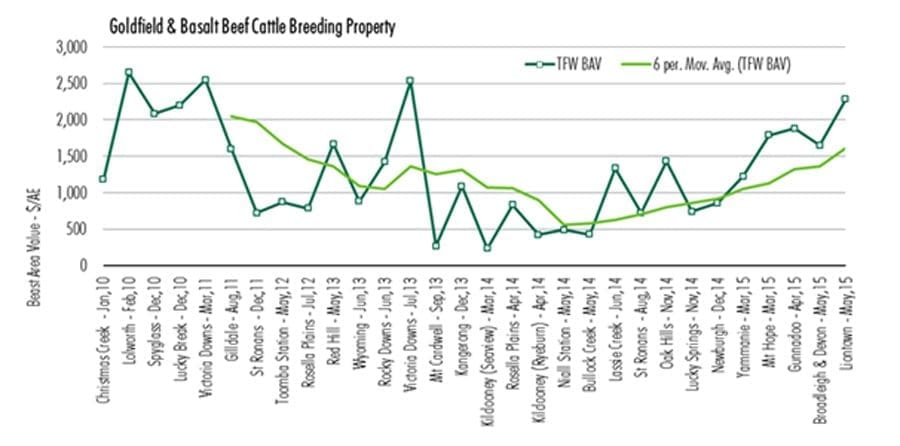
Click on image for a larger view
The chart published here shows a series of peaks and troughs. Mr Honnef said a number of factors were responsible for the lows, starting with the Global Financial Crisis from 2008 which knocked the confidence out of the industry.
“In 2010, confidence was returning to the beef sector. Then the Federal Government banned live exports to Indonesia and the market crashed. It knocked the wind out of the northern beef property sales sector,” Mr Honnef said.
“The following year the drought started, and in 2012 there was below average rainfall across many parts of Queensland. The situation continued, leading to severe drought conditions and disappearing cash flows. Many people who purchased properties at the peak in 2006-07 were forced into receivership and property prices plummeted.”
And the peaks? Mr Honnef said it was important not to interpret the graph as a ‘trend line chart’ because it is an ‘actual price chart’.
“It reflects property type values, not averages. Sales that show a peak are quality properties, or properties that are close to town, and are valued higher. Not all properties in the same area have the same values because they have different features and characteristics,” he said.
What is interesting is that all the property purchases have been by locals, and that is why Mr Honnef believes this region, at least, is now in a rising market.
“From March onwards, all those properties that had been on the market for a number of years, sold. The market is now meeting vendor’s prices,” he said.
Chart shows change in buyer thinking
Mr Honnef said while foreign investors have paid some record property prices recently, this was not a true indicator of local market sentiment.
“What this chart shows is the change in thinking of northern farming families growing beef. They are now willing to pay above $1000/ beast area for a property in the region analysed. Six months ago, they were paying below $1000/ beast area.”
Mr Honnef said market sentiment changed mid-year when there was a lot of talk about foreign investment, food security and rising middle classes in Asia demanding westernised foods and lifestyles.
“Now there’s the anticipation of a wet season and as a result, people are starting to become more optimistic and confident. However, the real driver is higher beef prices.”
“If people have the capacity and ability, they should be making acquisitions. Producers are far better buying now (in a drought) than waiting for rain, because the markets will increase. Now is the time. My opinion is that we have moved from the bottom of the market to a rising market,” Mr Honnef said.
So where is the chart plot-line headed?
According to Mr Honnef, up, up and up.
“Queensland will get a season. It may not be average or above average rainfall, but any sort of season will create some feed, and opportunities. Strong cattle prices, coupled with strong demand, will push beef prices even higher, and they are one of the core catalysts to property value changes. Higher beef prices will keep pushing up property prices.”
Mr Honnef said the Australian property market hit a peak in 2006-2007 and he predicts those levels will be reached again within the next 18 to 24 months.


Karl,
Combination of historical stocking rates, district averages and land classification exercise, apportioning carrying capacity across land types. Sales brochure information can be a guide but there is often a motivation to be optimistic when it comes to selling and carrying capacities.
Thank-You Peter for responding to my earlier comments.
Summation works fine in the areas closer-in, where there are many moving parts to the farming enterprise, and maybe the highest and best use is nothing to do with grazing; but lends itself to more intensive pursuits, or sometimes, residential development.
As a valuation method, it does not suit pastoral zone grazing enterprises a bit further out.
The business of grazing is not about the land component alone, but also about the other component parts of an Enterprise Valuation (EV) which values the total assets of the going concern business WIWO; less any surplus assets.
The other parts of an apportionment for a going concern (with all things necessary), once the EV has been calculated, are the Stock-on-Hand, and the Plant & Equipment (at Depreciated Replacement Cost), which are deducted from the EV to arrive at the Land & Improvements Value (a BARE basis).
BAV may not be sophisticated, but as used by generations of Graziers and Pastoralists, that is its strength!
It may be used in a positive fashion (top-down) by dividing the gross sale price WIWO, by the sustainable carrying capacity of the property.
Conversely, it may be calculated in a normative fashion (bottom-up), as valuation for investment purposes is all about the future expectations. This is because by definition, BAV is the economic value a beast will return to a Grazier, during its time on a particular property.
The latter value (normative) may be considered the value-line, and the former (positive) may be considered the market-line. They will rarely agree; and the ‘gap’ may be seen like a premium/discount to ‘fair investment value’.
Peter, I agree you must compare like with like. However, what happens when the original numbers used as market-based evidence have been calculated fallaciously? If the base-line is incorrect, does this not mean garbage-in and garbage-out (GIGO) for your forecasting?
The BAV approach and methodology was used by Graziers, as I have described above, for decades; until for some reason yet to be proved, the focus shifted away from the enterprise, towards the land component only, sometime around 1983. I can only assume this was tied-in with the funding approval decision.
The actual data from sales as market evidence is a fact; however, when making decisions in this space, and especially in the pastoral zone grazing enterprise valuation space, tread warily.
Fundamental Analysis of a business, looking back to learn, and forward to grow, is essential; and, remember Investors, if you borrow, you must have the capacity to repay the capital: and that is why the underlying business must be robustly productive, and with a decent margin-of-safety.
Do not expect that land values will rise indefinitely as a part of your exit strategy; as they have done in the past.
If anyone is interested, beast area values in the NT (as used properly on a WIWO basis) are around $1,500 per beast area; and in Queensland, they are around $1,800 per beast area. The difference is probably due to the tyranny of distance to market, and the lighter cattle that are the product of the NT.
If one were to take the NT BAV of $1,500 and divide it by the individual property’s sustainable stocking rate (SSR) looking through a rolling 10-year cycle, the answer would be the Dollars per Unit of Area (DUA); which when multiplied by the Area of the property, will give the WIWO expected value (on a Normative basis).
Price is what you pay; and value is what you get! So do not over-pay, as you make your money when you buy, not when you sell.
I hope that helps.
Peter
How do you come up with carrying capacity? Do you use the information of the sales brochure or something else or a combination? I know its not going to be perfect but was just curious as its part of the equation.
K
Michael,
Rule 1 – compare like with like.
Not all property sell walk in walk out (wiwo), some do and others sell without cattle, crops, plant or equipment being bare/improved.
So the best method to compare like with like is to bring the evidence back to a common value level, which may be bare/improved, treated fence and watered or even down to unimproved value where the added value of all improvements are deducted which state governments do when assessing rating/rental values.
A beast area value (BAV) is merely dividing the overall price/value by the carrying capacity. Again to keep in line with rule 1, carrying capacity should be standardized and the best way is to treat stock on an equivalent basis. In cattle it is widely accepted that a 450kg non lactating beast is a good measure of an adult equivalent (AE).
Critically, property should never be valued on an animal equivalent value rate (BAV) basis. $/AE. The primary assessment must be using land area value rates where the features of sales and subject are compared to then deduce an applicable $/ha value rate. BAV’s are only useful to then check the primary assessment to gauge if there is proper relativity when using productive unit value rates (BAV’s). The benefit of BAV’s is that you have a measure that incorporates value and productivity, in other words, value and use which are the strongest correlating factors in regard to asset worth.
Another pitfall that often comes to light is when market information is analysed one way but when determining value, another set of variables is applied.
For example, sales might be analysed to a treated fenced and watered (TFW) level due to variations in how they sold (wiwo or bare) but also due to difference in the standard, condition and extent of fixed building improvements.
The analysis of the sales will deduct the market indicated value of livestock, plant, equipment and added value of buildings to reveal the TFW price of each sale. Dividing the TFW price by the land area reveals each sale’s land area value rate, $/ha.
Then when assessing value of a property, and following the principle of like with like throughout the whole exercise, the same set of component values are summated (added value of buildings, value of plant, equipment and livestock) to reveal the wiwo value of the property as at that date and therefore being reflective of the prevailing market climate.
Rule 2 – Keep it simple!
Excellent article quoting Peter’s research, and it is good to see BAV Being used as an index again.
However, I find it interesting you are using the Goldfields type country around Charters Towers, as an indicative benchmark for Queensland, when most sales in that drier than elsewhere region, are forced sales. You certainly get scale in that area; and you need it too!
Also, BAV is a going concern concept, Walk-In Walk-Out (WIWO), with all things necessary. Why are you using it to value a property on a BARE basis?